Concept
Version 5
Created by Boundless
Sensitivity Analysis

Sensitivity of a Variable
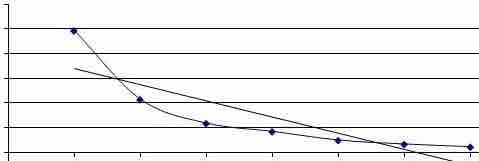
Sensitivity analysis determines how much an output is expected to change due to changes in a variable or parameter. In this case, the output (y-axis) decreases exponentially with an increase in the input (x-axis). This is mapped out for each input.
Source
Boundless vets and curates high-quality, openly licensed content from around the Internet. This particular resource used the following sources:
"All sizes | exponential curve data | Flickr - Photo Sharing!."
http://www.flickr.com/photos/rlodan01/4387091613/sizes/m/in/photostream/
Flickr
CC BY-SA.