Concept
Version 5
Created by Boundless
Overview of How to Assess Stand-Alone Risk

Coefficient of Variation
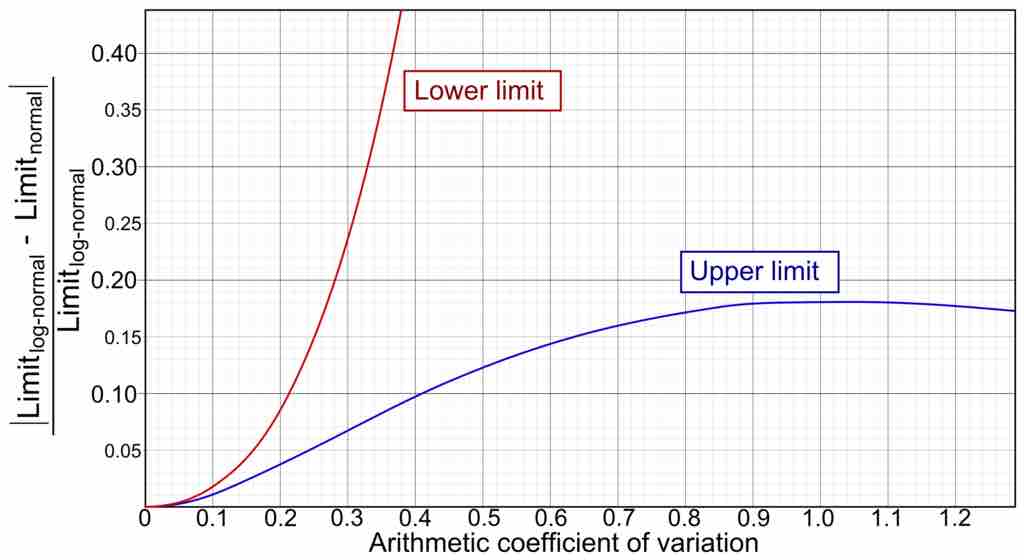
The coefficient of variation, an example of which is plotted in this graph, can be used to measure the ratio of volatility to expected return.
Source
Boundless vets and curates high-quality, openly licensed content from around the Internet. This particular resource used the following sources:
"Diagram of coefficient of variation versus deviation in reference ranges erroneously not established by log-normal distribution."
http://commons.wikimedia.org/wiki/File:Diagram_of_coefficient_of_variation_versus_deviation_in_reference_ranges_erroneously_not_established_by_log-normal_distribution.png
Wikimedia
CC BY.