NPV Profiles
The NPV calculation involves discounting all cash flows to the present based on an assumed discount rate. When the discount rate is large, there are larger differences between PV and FV (present and future value) for each cash flow than when the discount rate is small. Thus, when discount rates are large, cash flows further in the future affect NPV less than when the rates are small. Conversely, a low discount rate means that NPV is affected more by the cash flows that occur further in the future.
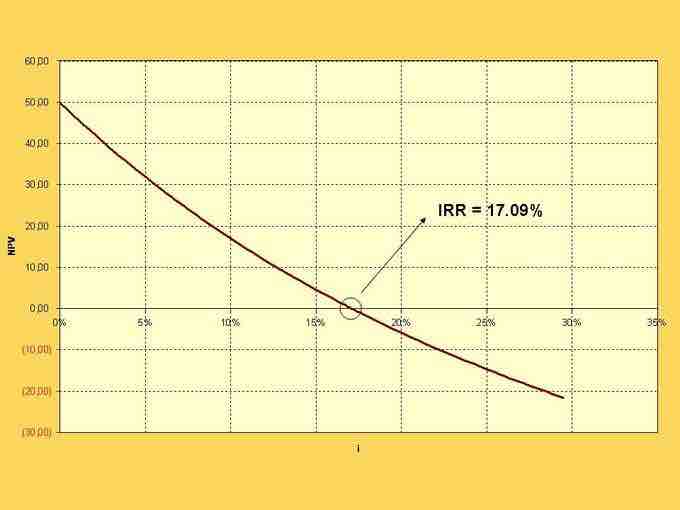
The relationship between NPV and the discount rate used is calculated in a chart called an NPV Profile . The independent variable is the discount rate and the dependent is the NPV. The NPV Profile assumes that all cash flows are discounted at the same rate.

NPV Profile
The NPV Profile graphs how NPV changes as the discount rate used changes.
The NPV profile usually shows an inverse relationship between the discount rate and the NPV. While this is not necessarily true for all investments, it can happen because outflows generally occur before the inflows. A higher discount rate places more emphasis on earlier cash flows, which are generally the outflows. When the value of the outflows is greater than the inflows, the NPV is negative.
A special discount rate is highlighted in the IRR, which stands for Internal Rate of Return. It is the discount rate at which the NPV is equal to zero. And it is the discount rate at which the value of the cash inflows equals the value of the cash outflows.