Overview
In finance the yield curve is a curve showing several yields or interest rates across different contract lengths (two month, two year, 20 year, etc...) for a similar debt contract. The curve shows the relation between the (level of) interest rate (cost of borrowing) and the time to maturity, known as the "term," of the debt for a given borrower in a given currency. Based on the shape of the yield curve, we have normal yield curves, steep yield curves, flat or humped yield curves, and inverted yield curves .

Israel Shekel yield curve
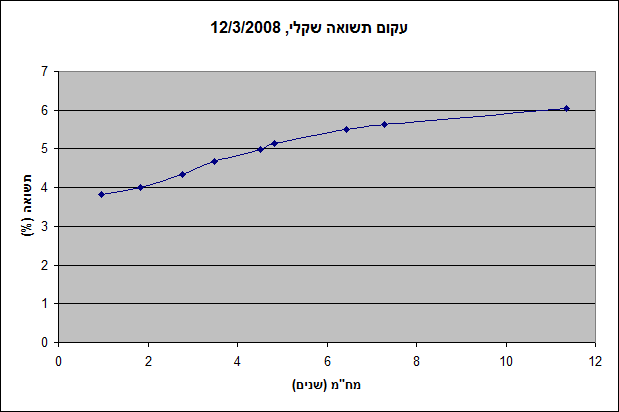
This graph is an example of a yield curve on Israeli Non-Linked Fixed Rate government bonds.
The yield curve is normal meaning that yields rise as maturity lengthens (i.e., the slope of the yield curve is positive). This positive slope reflects investor expectations for the economy to grow in the future and, importantly, for this growth to be associated with a greater expectation that inflation will rise in the future rather than fall. This expectation of higher inflation leads to expectations that the central bank will tighten monetary policy by raising short term interest rates in the future to slow economic growth and dampen inflationary pressure.
Shapes of Curves
Sometimes, treasury bond yield averages higher than that of treasury bills (e.g. 20-year Treasury yield rises higher than the three-month Treasury yield). In situations when this gap increases, the economy is expected to improve quickly in the future. This type of steep yield curve can be seen at the beginning of an economic expansion (or after the end of a recession). Here, economic stagnation will have depressed short-term interest rates. However, rates begin to rise once the demand for capital is re-established by growing economic activity.
A flat yield curve is observed when all maturities have similar yields, whereas a humped curve results when short-term and long-term yields are equal and medium-term yields are higher than those of the short-term and long-term. A flat curve sends signals of uncertainty in the economy.
An inverted yield curve occurs when long-term yields fall below short-term yields. Why this would happen is that when lenders are seeking long-term debt contracts more aggressively than short-term debt contracts. The yield curve "inverts," with interest rates (yields) being lower and lower for each longer periods of repayment so that lenders can attract long-term borrowing .
Theories
There are three main economic theories attempting to explain different term structures of interest rates. Two of the theories are extreme positions, while the third attempts to find a middle ground between the former two.
The expectation hypothesis of the term structure of interest rates is the proposition that the long-term rate is determined by the market's expectation for the short-term rate plus a constant risk premium. Shortcomings of expectations theory is that it neglects the risks inherent in investing in bonds, namely interest rate risk and reinvestment rate risk.
The liquidity premium theory asserts that long-term interest rates not only reflect investors' assumptions about future interest rates, but also include a premium for holding long-term bonds (investors prefer short term bonds to long term bonds), called the term premium or the liquidity premium. This premium compensates investors for the added risk of having their money tied up for a longer period, including the greater price uncertainty. Because of the term premium, long-term bond yields tend to be higher than short-term yields, and the yield curve slopes upward. Long term yields are also higher not just because of the liquidity premium, but also because of the risk premium added by the risk of default from holding a security over the long term.
In the segmented market hypothesis, financial instruments of different terms are not substitutable. As a result, the supply and demand in the markets for short-term and long-term instruments is determined largely independently. Prospective investors decide in advance whether they need short-term or long-term instruments. If investors prefer their portfolio to be liquid, they will prefer short-term instruments to long-term instruments. Therefore, the market for short-term instruments will receive a higher demand. Higher demand for the instrument implies higher prices and lower yield. This explains the stylized fact that short-term yields are usually lower than long-term yields. This theory explains the predominance of the normal yield curve shape. However, because the supply and demand of the two markets are independent, this theory fails to explain the observed fact that yields tend to move together (i.e., upward and downward shifts in the curve).