Price Indices
Price indices are tools used to measure price changes for a specific subset of goods and services. A price index is a statistic designed to help compare how a normalized average of prices differ between time periods. Broad price indices, such as the consumer price index (CPI) or the GDP deflator are often used to measure inflation throughout the entire economy, while narrower ones, such as the consumer price index for the elderly (CPI-E) measure the inflation experienced by specific groups of people or industries.
In order to calculate a price index, one must specify a base period and a basket of goods. The base period is the time period against which costs in other periods will be compared. Most often, the base period for an index is a single year and normalized. For example, a the CPI could select 1950 as the base year. In 1950, the CPI would have a value of 100 (this is not the cost of the basket, just a normalized value). Suppose that in 1960, the cost of the basket has increased 15%. The CPI in 1960 would then be listed as 115 (15% greater than the base year).
The basket of goods determines which prices are being compared. If a price index wanted to measure the inflation experienced by young people on the west coast of the United States, for example, it would first have to calculate which goods these particular consumers purchase and in what quantities. For example, this population may spend 40% of its income on housing, 10% on food, 10% on transportation, 20% on entertainment, and 20% on surfing supplies. The basket of goods should reflect these proportions.
Calculating Price Indices
There are different ways to calculate price indices. Suppose we want to find the inflation rate for consumers who, in the base period, bought an average of five CDs ($10 each), eight cans of soda ($1.5 each), and two pairs of shoes ($40 each). In the current period, the same type of consumer bought an average of four CDs ($12 each), six cans of soda ($2 each), and two pair of shoes ($45 each). One very basic approach to finding this price index might multiply the items' cost and the quantity bought in the base period, and compare that to the cost and quantity in the current period. This calculation would give:
5*10+8*1.5+2*40 = 142 (base period)
4*12+6*2+2*45 = 150 (current period)
Price index = (150/142)*100 = 105.6
This would show that inflation was 5.6%.
However, this is not a very practical way to measure the change in prices since it compares two different baskets of goods. In this type of approach, a higher index number in the current period might mean that prices have gone up, but it might also mean that incomes have risen and people are simply buying more goods. The Laspeyres index and the Paasche index are two price indexes that attempt to compensate for this difficulty.
The most commonly used formula is a form of the Laspeyres price index, which determines a basket of goods during a base period, finds the price of this basket, and then compares that to the price of the same basket of goods in a later period of time. Using the example above, the base period index would be 5*10+8*1.5+2*40=142, and the current period index would be 5*12+8*2+2*45 = 166. The Laspeyres price index is (166/142)*100=116.9, giving an inflation rate of 16.9%.
An alternate type of index, the Paasche index, finds a basket of goods in the current period, determines it's total price, and compares that price to what the current basket of goods would have cost in the base period. Again, using the above example, the base period index would be 4*10+6*1.5+2*40=129, and the current period index would be 4*12+6*2+2*45=150. The Paasche index is (150/129)*100=116.3, giving an inflation rate of 16.3%.
Common Price Indices
Two common price indices are the Consumer Price Index (CPI) and the Producer Price Index (PPI). The CPI reflects changes in the prices of goods and services typically purchased by consumers, and includes price changes in imported goods. The CPI is often used to measure changes in the cost of living .

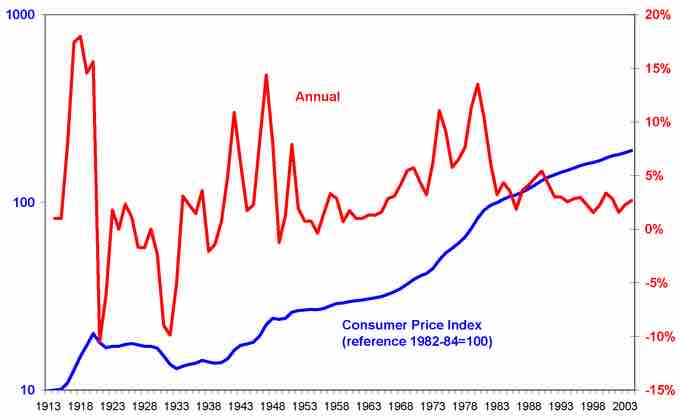
Consumer Price Index and Inflation
The above graph shows the annual inflation rate and the consumer price index from 1913 to 2003. As long as the inflation rate was above zero, the CPI was increasing.
The PPI, on the other hand, reflects changes in the revenue that producers receive in return for goods and services. The PPI, unlike the CPI, includes price changes for goods produced within the US but exported abroad. It also does not include sales and excise taxes, nor does it include distribution costs. While we often expect the CPI and PPI to show similar rates of inflation, they measure two different sets of price changes.