Economic Growth
Economic growth is the increase in the market value of goods and services produced by an economy over a period of time. It is measured as the percentage rate increase in the real gross domestic product (GDP). On a global scale, economic growth is the sum of the growth of individual countries to give a worldwide total. Economic growth and global impact varies by country based on the individual economy, the development of the country, accumulation of human and physical capital, and level of productivity .

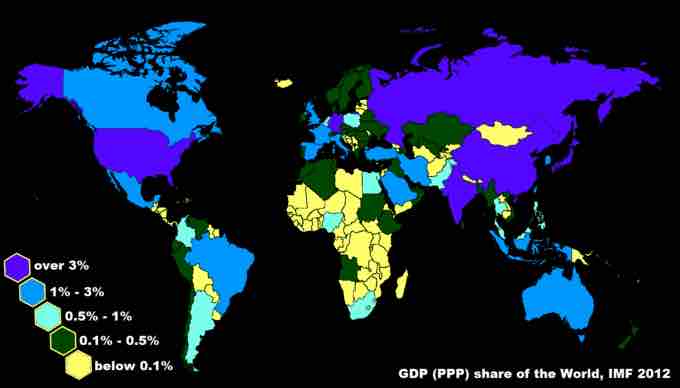
Share of World GDP
This image shows the share of GDP worldwide. The economic growth and global impact that each country has is influenced by the individual economy, the development of the country, accumulation of human and physical capital, and level of productivity.
Global Economic Growth
Due to the vast number of countries globally, the world economy is usually determined in monetary terms, even in cases where no efficient market is available to evaluate goods and services. The market valuations are translated into a single monetary unit using the idea of purchasing power. Analyzing economic growth in prominent countries provides an overview of global economic growth .

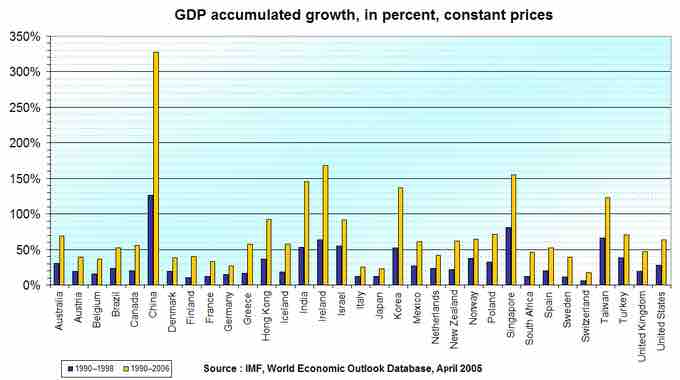
Change in GDP
This graph shows the change in GDP for countries around the world for 1900 to 1999 and 1999 to 2006. The GDP for each individual country is used to determine the global economic growth.
- 1980 to 1990: during this time period the economic output of 112 countries expanded while the output of 34 countries contracted. The purchasing power expanded for 145 markets and contracted for two. The five largest contributors to global output contraction were Argentina, Saudi Arabia, Nigeria, Venezuela, and Vietnam.
- 1990 to 2000: the United States dominated expansion during these years. The economic output expanded for 122 countries and contracted for 29. The purchasing power increased for 148 markets and contracted for three. The five largest contributors to global output contraction were Italy, Finland, Bulgaria, Algeria, and the Demographic Republic of Congo.
- 2000 to 2006: Expansion in China moved the country closer to the United States. The economic output for 176 countries expanded and four contracted. The five largest contributors to the expansion were the United States, China, Germany, the United Kingdom, and France. The purchasing power increased for 180 markets. The largest global output contributors were the United States, China, India, Japan, and Russia. From 2000 to 2010 these was a rise in developing and emerging economies.
- 2007: The nominal GDP expanded in 183 countries. The largest contributors were China, the U.S., Germany, and the United Kingdom.
- 2008: the credit crisis started. Economic output expanded in 171 countries, but 11 countries experienced output contractions. The United Kingdom accounted for half the global contraction while South Korea accounted for two-fifths. The crisis impacted most countries, but it was not deep enough to reverse growth.
- 2009: the credit crisis spread. The economic output of 127 countries contracted. The United Kingdom was impacted the most, followed by Russia and Germany. 56 countries experienced expansion of economic output, including China, Japan, and Indonesia. The purchasing power contracted for 79 markets. The U.S. was the largest victim and accounted for 18%, followed by Japan and Russia. 104 markets expanded purchasing power including China, India, and Indonesia.
- 2010: the economic output expanded for 148 countries and contracted for 35. The purchasing power increased for 169 markets and contracted for 14. It was noted that banks faced a "wall" of maturing debt. The U.S. experienced economic recovery, but the global economic growth lost momentum.
- 2011 to 2012: in 2011 it was projected that global growth would drop 4% followed by another 3.5% drop in 2012.
- 2010 to 2018: it is projected that China will lead economic growth during this period. The global economic output is expected to expand by $32.9 trillion.
Power of Annual Growth
Over long periods of time, small rates of growth have large economic effects. For example, the United Kingdom experienced a 1.97% average annual increase in its GDP from 1830 to 2008. The growth rate averaged 1.97% over 178 years and resulted in a 32-fold increase in the GDP by 2008. The GDP in 1830 was £41,373. It grew to £1,330,088 by 2008.
A growth rate of 2.5% a year leads to a doubling of the GDP within 29 years. A growth rate of 8% a year leads to a doubling of the GDP in 10 years. As a result, small differences in economic growth rates between countries can produced very different standards of living for the populations if the small growth rate continues for many years.