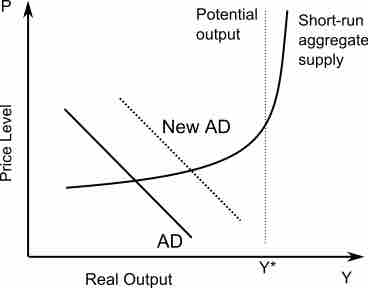
Aggregate Supply and Aggregate Demand
In economics, the aggregate supply (AS) is the total supply of goods and services that firms in an economy produce during a specific time period. It represents the total amount of goods and services that firms are willing to sell at a given price level. The aggregate supply curve is graphed as a backwards L-shape in the short-run and vertical in the long-run.
Aggregate demand (AD) is the total demand for final goods and services in the economy at a given time and price level. It shows the amounts of goods and services that will be purchased at all the possible price levels. When aggregate demand increases its graph shifts to the right. It shifts to the left when it decreases which shows a fall in output and prices.
The aggregate supply and aggregate demand determine the output and price for goods and services. The AD-AS model is used to graph the aggregate expenditure and the point of equilibrium .

AD-AS Model
This graph shows the AD-AS model where P is the average price level and Y* is the aggregate quantity demanded. The model is used to show how increases in aggregate demand leads to increases in prices (inflation) and in output.
Aggregate Expenditure
Aggregate expenditure is the current value of all the finished goods and services in the economy. The equation for aggregate expenditure is: AE = C + I + G + NX.
The aggregate expenditure equals the sum of the household consumption (C), investments (I), government spending (G), and net exports (NX).
Graphing Equilibrium
The AD-AS model is used to graph the aggregate expenditure at the point of equilibrium. The AD-AS model includes price changes. An economy is said to be at equilibrium when the aggregate expenditure is equal to the aggregate supply (production) in the economy. It is important to note that the economy does not stay in a state of equilibrium. The aggregate expenditure and aggregate supply adjust each other towards equilibrium. When there is excess supply over expenditure, there is a reduction in the prices or the quantity or output. When there is an excess of expenditure over supply, then there is excess demand which leads to an increase in prices out output. In an effort to adjust and reach equilibrium, the economy constantly shifts between excess supply and excess demand. This shift is graphed using the AD-AS model which determines the output and price for the good or service.