Aggregate demand (AD) is the summation of all demand within a given economy at a given time.
Inputs
There are four inputs to consider in calculating AD (and deriving the graphical curve which represents it): consumption (C), investment (I), government spending (G), and net exports (NX, which is exports (X) – imports (I)). Changes in these inputs will have some influence on the AD curve. For example, an increase in total expenditures will result in a shift rightwards, while a decrease in expenditure will result in a shift to the left.
Aggregate Demand Curves
Two specific AD representations are useful to consider:
- Keynesian Cross: The Keynesian Cross is a simple illustration of the relationship between aggregate demand and desired total spending (linear at 45 degrees). The intersecting AD line will generally have an upwards slope, under the assumption that increased national output should result in increased disposable income.
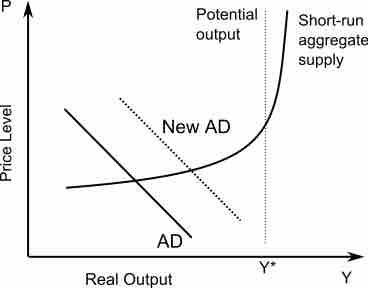
- Aggregate Demand/Aggregate Supply Model (AD/AS):The x-axis represents the overall output, while the y-axis represents the price level. The aggregate quantity demanded (Y = C + I + G + NX) is calculated at every given aggregate average price level.
Exogenous Effects
There are a variety of direct and indirect consequences to AD shifts. For the purpose of this discussion, the key consequences to keep in mind are changes in output and price. Below are some of the driving forces that will shift aggregate demand to the right:
- An exogenous increase in consumer spending;
- An exogenous increase in investment spending on physical capital;
- An exogenous increase in intended inventory investment;
- An exogenous increase in government spending on goods and services;
- An exogenous increase in transfer payments from the government to the people;
- An exogenous decrease in taxes levied;
- An exogenous increase in purchases of the country's exports by people in other countries; and
- An exogenous decrease in imports from other countries.
Short-term Implications
As noted above, any increase in the overall AD will result in an outwards (right-ward) shift of the AD curve. (Conversely, a decrease in aggregate demand will cause a leftward shift of the AD curve. ) This means that an increase in any of the four inputs to AD will result in a higher quantity of real output or an increase in prices across the board (this is also known as inflation). However, different levels of economic activity will result in different combinations of output and price increases.
is useful for understanding the distribution between price increases and output increases that will result in a given economy when AD increases. To put simply, the lower the utilization of available resources in a system, the more an increase in AD will result in higher output and thus higher employment and GDP growth. However, as the system evolves and aligns itself closer to the highest potential output (optimal utilization of resources or Y*), scarcity will naturally cause the prices to increase more than the overall output in a system. This is somewhat intuitive economically when scarcity and utilization are taken into account. The more difficult it is to generate a supply increase the more likely a shift in AD will drive up prices.

Aggregate Supply/Aggregate Demand
This graph illustrates the relationship between price and output within a given economic system in the context of aggregate demand and supply.