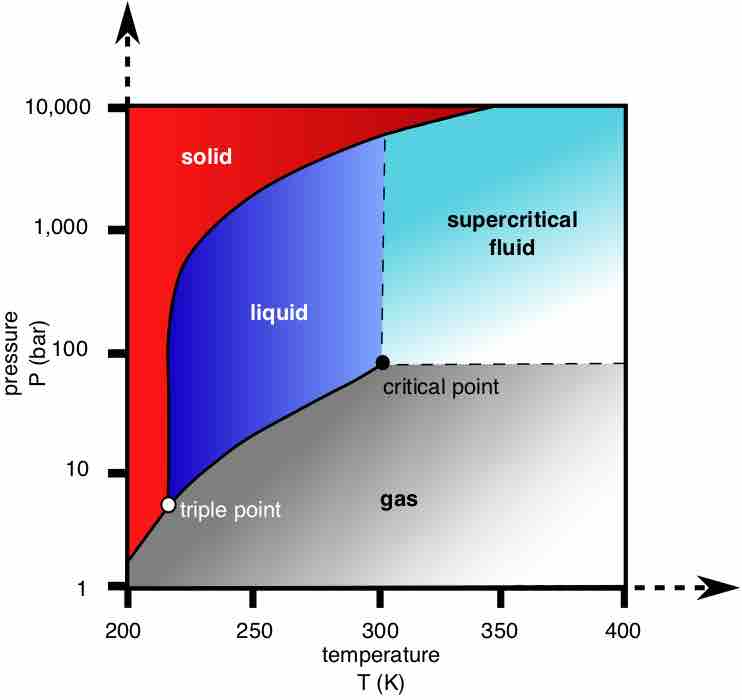
Visually appealing graphs help audience comprehension
Graphs, images, and other sensory enhancements help the audience to better comprehend and remember a presentation.
Source
Boundless vets and curates high-quality, openly licensed content from around the Internet. This particular resource used the following sources:
"File:Carbon dioxide pressure-temperature phase diagram.svg - Wikipedia, the free encyclopedia."
http://en.wikipedia.org/w/index.php?title=File:Carbon_dioxide_pressure-temperature_phase_diagram.svg&page=1
Wikipedia
CC BY-SA.