The apparent similarity of the terms
Plotting
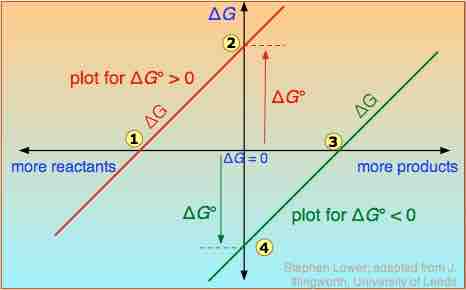
The distinction is nicely illustrated in this diagram , in which

ΔG vs. G°
ΔG is plotted on a vertical axis for two hypothetical reactions having opposite signs of ΔG°.
Take careful note of the following:
- The red line on the left plots the values of
$\Delta G$ for the$\Delta G^{\circ}$ > 0 reaction. Notice that there are an infinite number of these values, depending on the progress of the reaction. In contrast, there is only a single value (point 2) of$\Delta G^{\circ}$ , corresponding to the composition at which$\Delta G$ = 0 (point 1). - At this point, some products have been formed, but the composition is still dominated by reactants.
- If the reaction begins at a composition to the left of point 1 on the diagram,
$\Delta G$ will be negative and the composition will move to the right. Similarly, if the reaction begins with a composition to the right of point 1 on the diagram,$\Delta G$ will be positive and the composition will move to the left. - The plot on the right is for the
$\Delta G^{\circ}$ < 0 reaction, for which$\Delta G^{\circ}$ is shown at point 4 on the diagram. At its equilibrium point (point 3), there are more products than reactants. If the reaction starts at a composition to the right of point 3 on the diagram, the composition will tend to move to the left. If the initial composition is to the left of point 3 on diagram, the reaction will tend to proceed to the right. - What would happen if
$\Delta G^{\circ}$ were 0? The equilibrium point of such a reaction would be at the origin, corresponding to half the reactants being converted to products.
The important principle to understand is that a negative
Possible Values
In contrast, the composition of a chemical reaction system undergoes continual change until the equilibrium state is reached. Therefore, a single reaction can have an infinite number of
In the example of a reaction

Nonstandard state free energy change
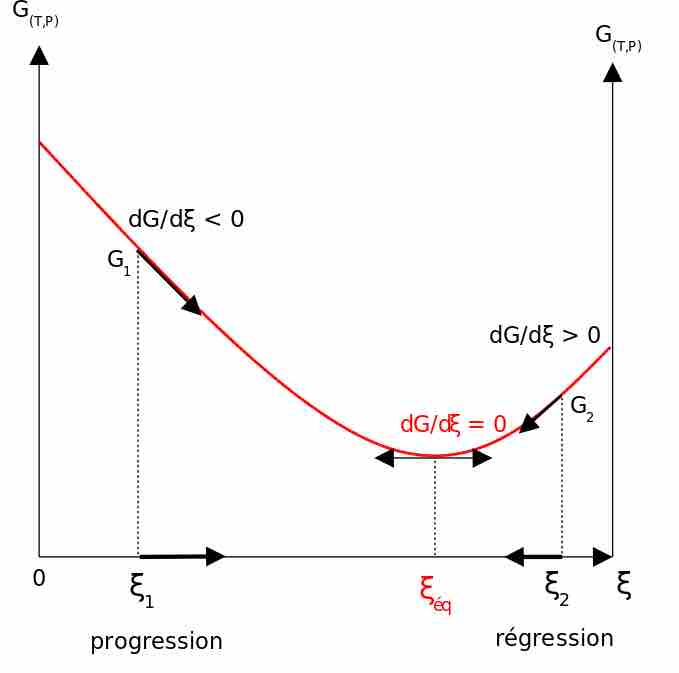
Graph of
The physical meaning of