Isotherms and the P-V Diagram
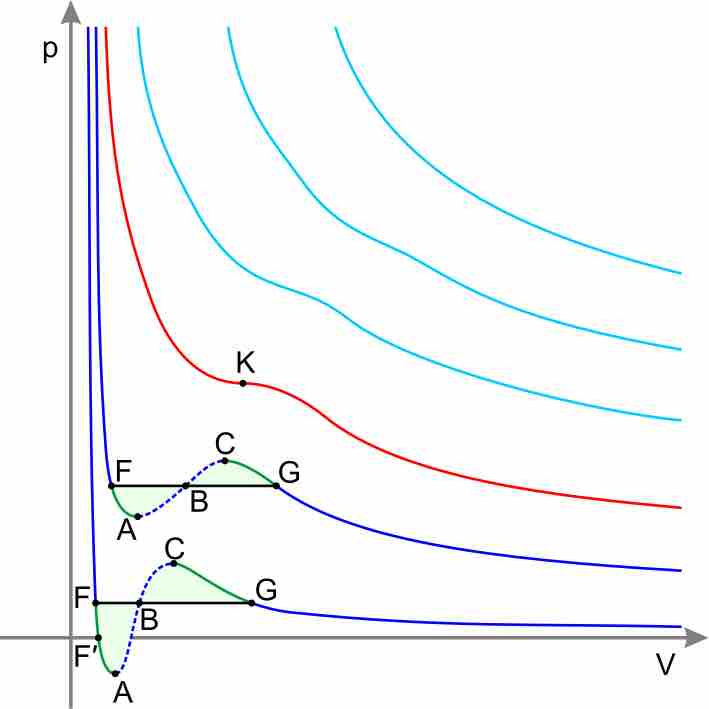
The Ideal Gas Law assumes that a gas is composed of randomly moving, non-interacting point particles. This law sufficiently approximates gas behavior in many calculations; real gases exhibit complex behaviors that deviate from the ideal model, however, as shown by the isotherms in the graph below. (Isotherms refer to the different curves on the graph, which represent a gas' state at different pressure and volume conditions but at constant temperature; "Iso-" means same and "-therm" means temperature—hence isotherm.)

Real-gas isotherms
According to the Ideal Gas Equation, PV=nRT, pressure and volume should have an inverse relationship. Notice that the higher isotherms on the graph, which represent the gas' state at higher temperature, show the typical, concave decreasing curve of an inverse relationship. As temperature decreases, however, the isotherms on the lower portion of the graph significantly deviate from this ideal inverse relationship between P and V.
Limitations of the Ideal Model
For most applications, the ideal gas approximation is reasonably accurate; the ideal gas model tends to fail at lower temperatures and higher pressures, however, when intermolecular forces and the excluded volume of gas particles become significant. The model also fails for most heavy gases (including many refrigerants) and for gases with strong intermolecular forces (such as water vapor). At a certain point of combined low temperature and high pressure, real gases undergo a phase transition from the gaseous state into the liquid or solid state. The ideal gas model, however, does not describe or allow for phase transitions; these must be modeled by more complex equations of state.
Real-gas models must be used near the condensation point of gases (the temperature at which gases begin to form liquid droplets), near critical points, at very high pressures, and in other less common cases. Several different models mathematically describe real gases.
van der Waals Model
Real gases are often modeled by taking into account their molar weight and volume:
where:
- P = pressure
- T = temperature
- R = the ideal gas constant
- V = volume
- a is an empirically determined factor that corrects for the intermolecular forces between gas particles; it is specific for each gas
- b is an empirically determined factor that corrects for the excluded volume of gas particles; it is specific for each gas
Redlich-Kwong Model
The Redlich-Kwong equation is another two-parameter relation that models real gases. It is almost always more accurate than the van der Waals equation and frequently more accurate than some equations with more than two parameters. The equation is:
Note that a and b here are defined differently than in the van der Waals equation.
Additional models that can be applied to non-ideal gases include the the Berthelot model, the Dieterici model, the Clausius model, the Virial model, the Peng-Robinson model, the Wohl model, the Beattie-Bridgeman model, and the Benedict-Webb-Rubin model. However, these systems are used less frequently than are the van der Waals and Redlich-Kwong models.
Compressibility Factor and Deviation from Ideality
Deviation from ideality can be quantified using the compressibility factor Z:
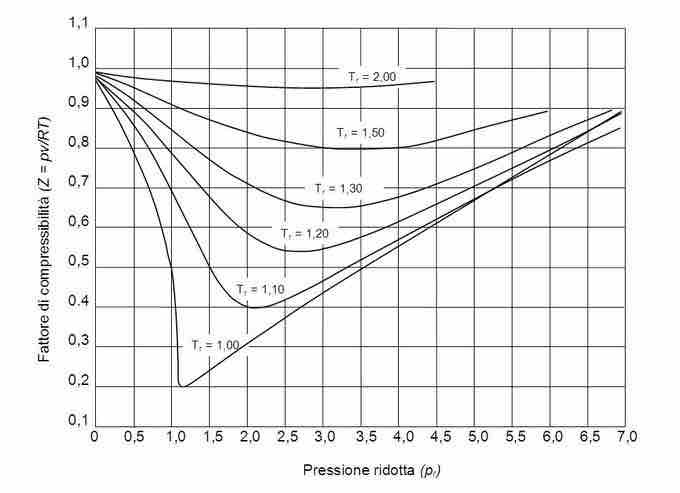
Note that for an ideal gas, PV=nRT, and Z will equal 1; under non-ideal conditions, however, Z deviates from unity. The graph below depicts how the compressibility factor varies with increasing pressure for a generalized graph. Note that the isotherms representing high temperatures deviate less from ideal behavior (Z remains close to 1 across the graph), while for isotherms representing low temperatures, Z deviates greatly from unity.

Compressibility factor and pressure
At low temperatures, the compressibility factor for a generalized gas greatly deviates from unity, indicating non-ideal gas behavior; at high temperatures, however, the compressibility factor is much less affected by the increased pressure.