Concept
Version 14
Created by Boundless
Real Gases

Real-gas isotherms
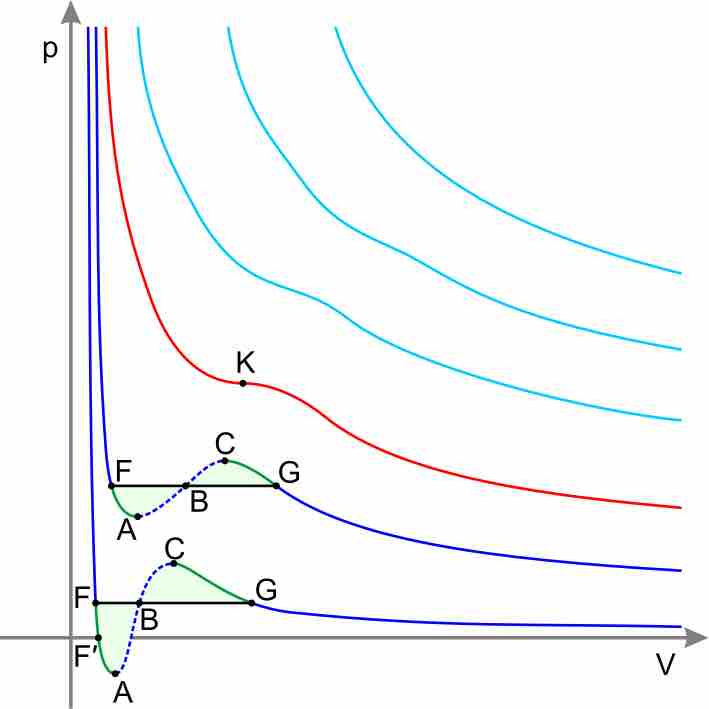
According to the Ideal Gas Equation, PV=nRT, pressure and volume should have an inverse relationship. Notice that the higher isotherms on the graph, which represent the gas' state at higher temperature, show the typical, concave decreasing curve of an inverse relationship. As temperature decreases, however, the isotherms on the lower portion of the graph significantly deviate from this ideal inverse relationship between P and V.
Graph with vertical axis pressure, horizontal axis volume. The high-temperature isotherms are farther from the axes and take the form of smooth inverse curves, decreasing pressure with volume. The low-temperature isotherms are close to the axes and are not smooth, initially decreasing as volume increases, then increasing with volume, then decreasing again.
Source
Boundless vets and curates high-quality, openly licensed content from around the Internet. This particular resource used the following sources:
"Real Gas Isotherms."
http://commons.wikimedia.org/wiki/File:Real_Gas_Isotherms.svg
Wikimedia
CC BY-SA.