Rate of Change
Linear equations often include a rate of change. For example, the rate at which distance changes over time is called velocity. If two points in time and the total distance traveled is known the rate of change, also known as slope, can be determined. From this information, a linear equation can be written and then predictions can be made from the equation of the line.
If the unit or quantity in respect to which something is changing is not specified, usually the rate is per unit of time. The most common type of rate is "per unit of time", such as speed, heart rate and flux. Ratios that have a non-time denominator include exchange rates, literacy rates, and electric field (in volts/meter).
In describing the units of a rate, the word "per" is used to separate the units of the two measurements used to calculate the rate (for example a heart rate is expressed "beats per minute").
Rate of Change: Real World Application
Example
An athlete begins he normal practice for the next marathon during the evening. At 6:00 pm he starts to run and leaves his home. At 7:30 pm, the athlete finishes the run at home and has run a total of 7.5 miles. How fast was his average speed over the course of the run?
The rate of change is the speed of his run; distance over time. Therefore, the two variables are time
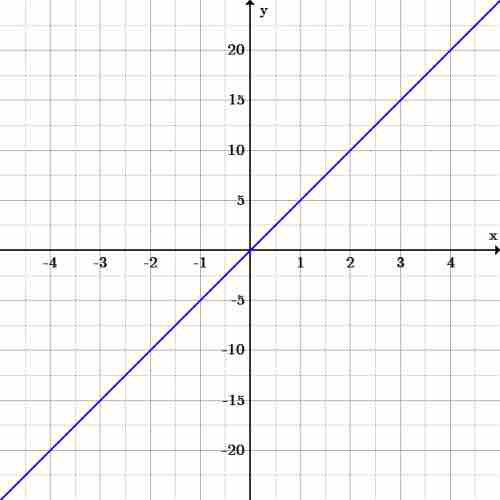
Example: Graph the line illustrating speed
To graph this line, we need the

Distance and time graph
The graph of
With this new function, we can now answer some more questions.
-
How many miles did he run after the first half hour? Using the equation, if
$x=\frac{1}{2}$ , solve for$y$ . If$y=5x$ , then$y=5(0.5)=2.5$ miles. - If he kept running at the same pace for a total of
$3$ hours, how many miles will he have run? If$x=3$ , solve for$y$ . If$y=5x$ , then$y=5(3)=15$ miles.
There are many such applications for linear equations. Anything that involves a constant rate of change can be nicely represented with a line with the slope. Indeed, so long as you have just two points, if you know the function is linear, you can graph it and begin asking questions! Just make sure what you're asking and graphing makes sense. For instance, in the marathon example, the domain is really only