Relationships between sets occur often in everyday life. For example, for each month in Cape Canaveral, we can associate an average amount of rainfall. In this case, the amount of precipitation depends on the month of the year, and the data can be written in tabular form or as a set of ordered pairs.
| Month | Precipitation | Ordered pairs |
|---|---|---|
| January | 2.4 in | (January, 2.4) |
| February | 3.3 in | (February, 3.3) |
| March | 3.1 in | (March, 3.1) |
| April | 2.0 in | (April, 2.0) |
| May | 3.8 in | (May, 3.8) |
| June | 6.8 in | (June, 6.8) |
| July | 8.1 in | (July, 8.1) |
| August | 7.6 in | (August, 7.6) |
| September | 7.3 in | (September, 7.3) |
| October | 4.1 in | (October, 4.1) |
| November | 3.3 in | (November, 3.3) |
| December | 2.4 in | (December, 2.4) |
We define a relationAny set of ordered pairs. as any set of ordered pairs. Usually we write the independent component of the relation in the first column and the dependent component in the second column. In the opening example, notice that it makes sense to relate the average amount of precipitation as dependent on the month of year. The set of all elements in the first column of a relation is called the domainThe set of first components of a relation. The x-values define the domain in relations consisting of points (x, y) in the rectangular coordinate plane.. The set of all elements that compose the second column is called the rangeThe set of second components of a relation. The y-values define the range in relations consisting of points (x, y) in the rectangular coordinate plane.. In this example, the domain consists of the set of all months of the year, and the range consists of the values that represent the average rainfall for each month.
In the context of algebra, the relations of interest are sets of ordered pairs (x, y) in the rectangular coordinate plane. In this case, the x-values define the domain and the y-values define the range. Of special interest are relations where every x-value corresponds to exactly one y-value; these relations are called functionsRelations where every x-value corresponds to exactly one y-value. With the definition comes new notation: , which is read “f of x is equal to y.”.
Example 1: Determine the domain and range of the following relation and state whether or not it is a function: {(−1, 4), (0, 7), (2, 3), (3, 3), (4, −2)}.
Solution: Here we separate the domain and range and depict the correspondence between the values with arrows.
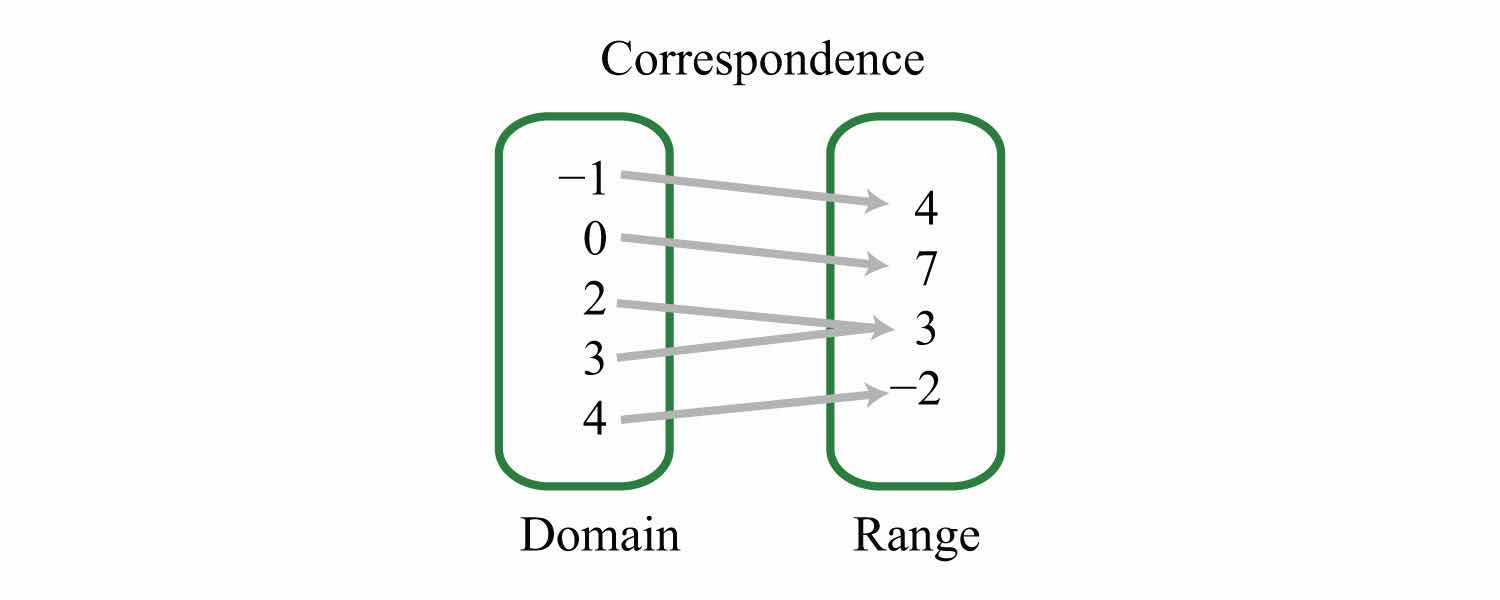
Answer: The domain is {−1, 0, 2, 3, 4}, and the range is {−2, 3, 4, 7}. The relation is a function because each x-value corresponds to exactly one y-value.
Example 2: Determine the domain and range of the following relation and state whether or not it is a function: {(−4, −3), (−2, 6), (0, 3), (3, 5), (3, 7)}.
Solution:
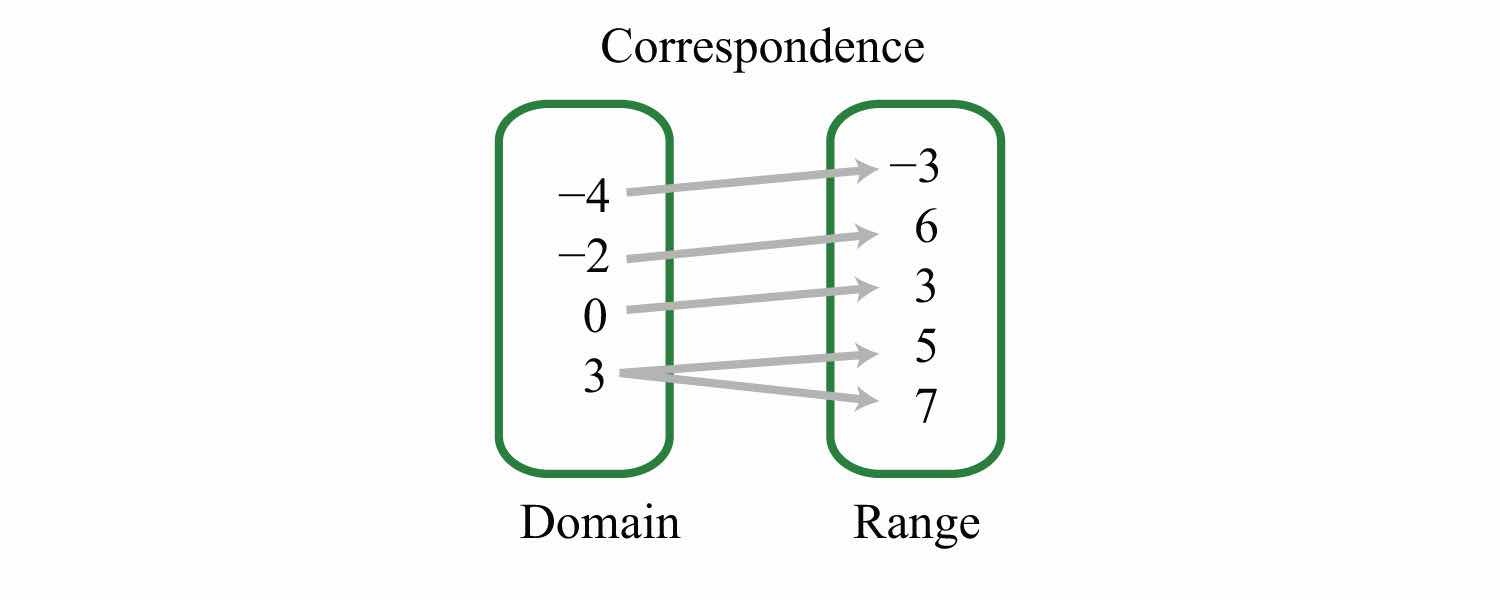
Answer: The domain is {−4, −2, 0, 3}, and the range is {−3, 3, 5, 6, 7}. This relation is not a function because the x-value 3 has two corresponding y-values.
In the previous example, the relation is not a function because it contains ordered pairs with the same x-value, (3, 5) and (3, 7). We can recognize functions as relations where no x-values are repeated.
In algebra, equations such as define relations. This linear equation can be graphed as follows:
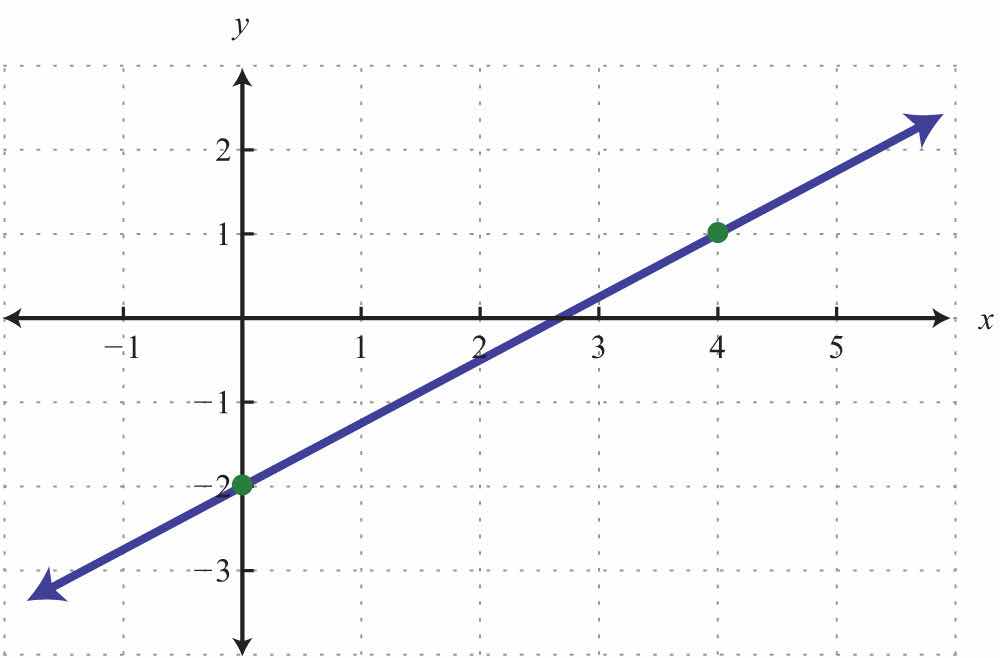
The graph is a relation since it represents the infinite set of ordered pair solutions to . The domain is the set of all x-values, and in this case consists of all real numbers. The range is the set of all possible y-values, and in this case also consists of all real numbers. Furthermore, the graph is a function because for each x-value there is only one corresponding y-value. In fact, any nonvertical or nonhorizontal line is a function with domain and range consisting of all real numbers.
Any graph is a set of ordered pairs and thus defines a relation. Consider the following graph of a circle:
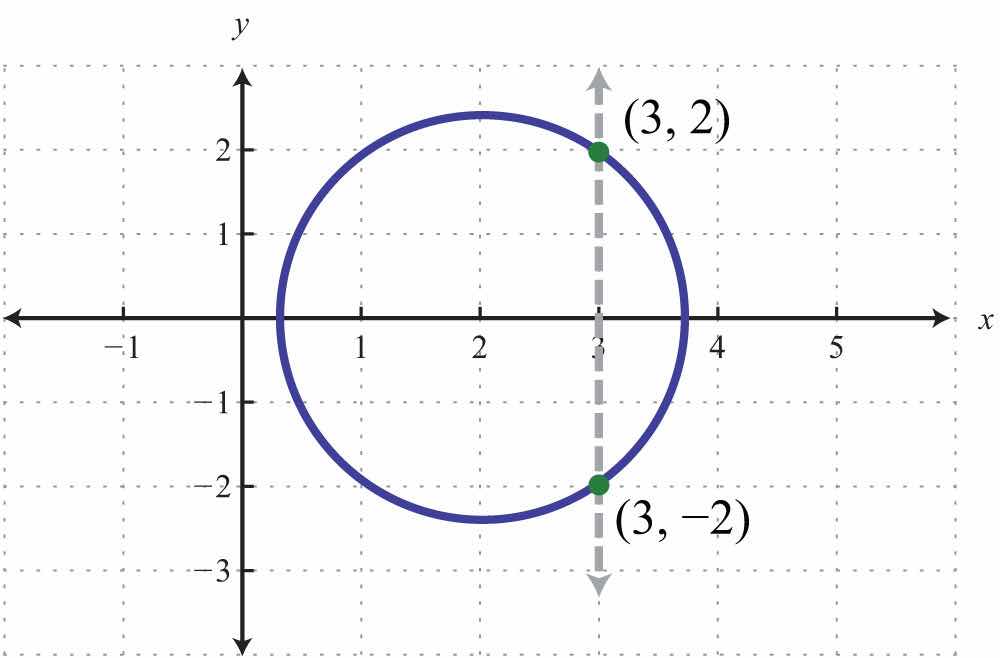
Here the graph represents a relation where many x-values in the domain correspond to two y-values. If we draw a vertical line, as illustrated, we can see that (3, 2) and (3, −2) are two ordered pairs with the same x-value. Therefore, the x-value 3 corresponds to two y-values; hence the graph does not represent a function. The illustration suggests that if any vertical line intersects a graph more than once, then the graph does not represent a function. This is called the vertical line testIf a vertical line intersects a graph more than once, then the graph does not represent a function..
Example 3: Given the following graph, determine the domain and range and state whether or not it is a function.
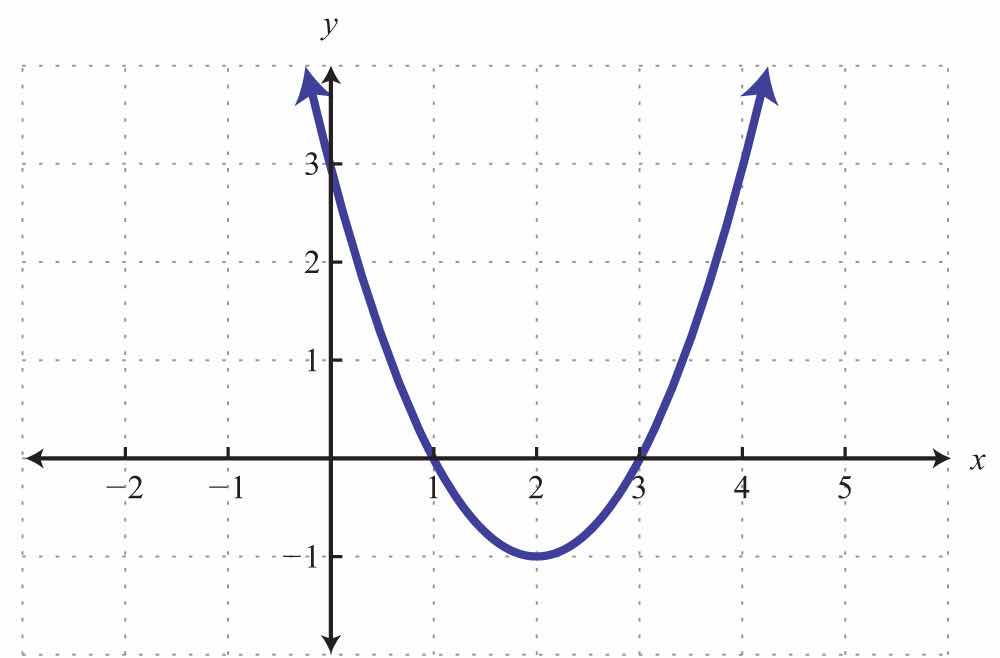
Solution: The given shape is called a parabola and extends indefinitely to the left and right as indicated by the arrows. This suggests that if we choose any x-value, then we will be able to find a corresponding point on the graph; therefore, the domain consists of all real numbers. Furthermore, the graph shows that −1 is the minimum y-value, and any y-value greater than that is represented in the relation. Hence the range consists of all y-values greater than or equal to −1, or in interval notation, .
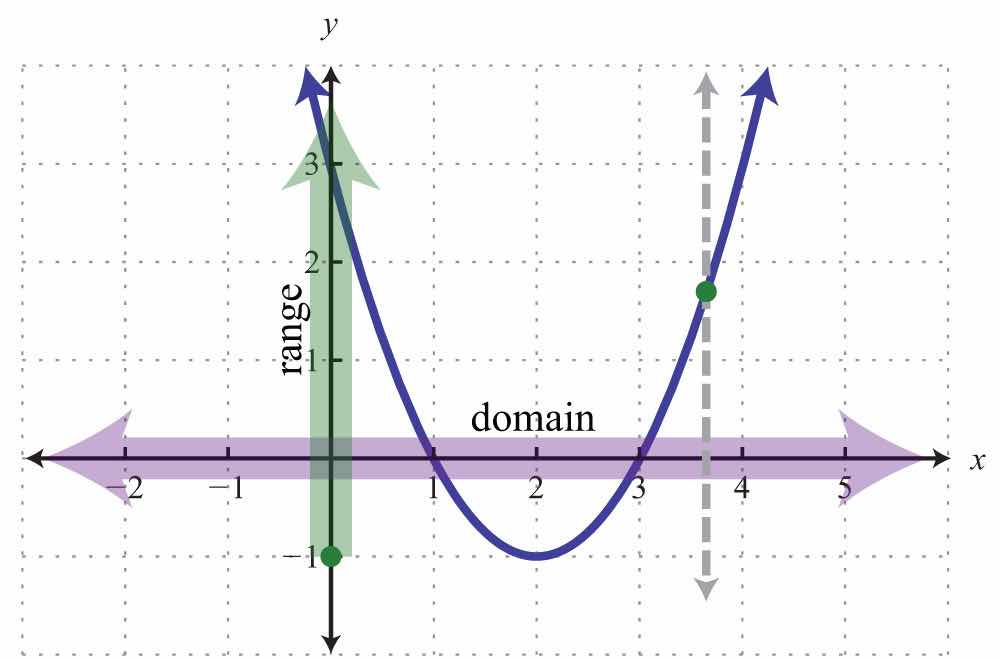
Lastly, any vertical line will intersect the graph only once; therefore, it is a function.
Answer: The domain is all real numbers R = (−∞, ∞), and the range is . The graph represents a function because it passes the vertical line test.
Try this! Given the graph, determine the domain and range and state whether or not it is a function:
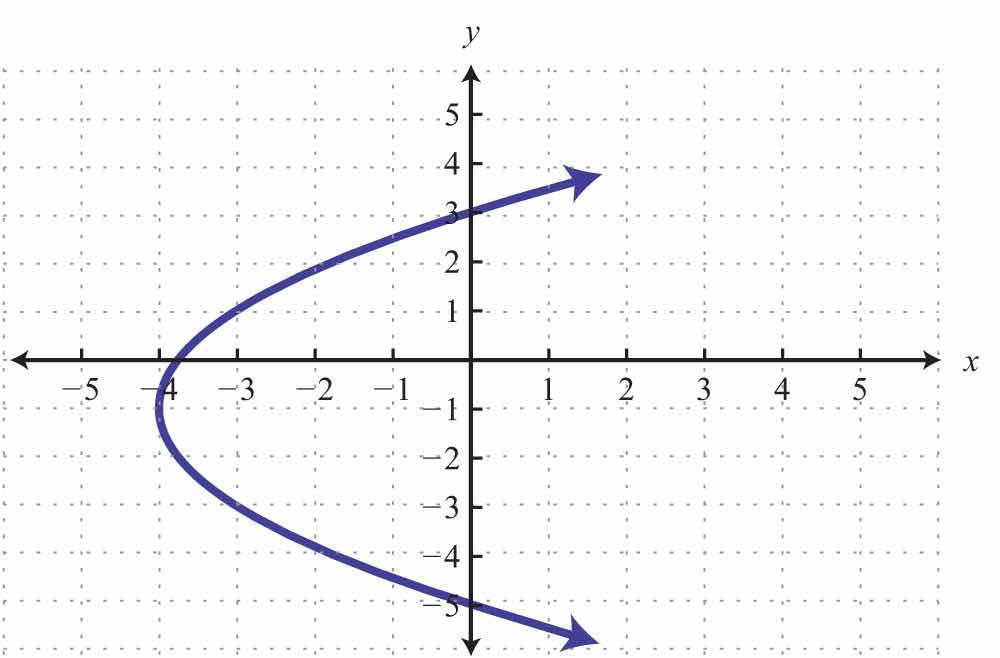
Answer: Domain: ; range: ; function: no
With the definition of a function comes special notation. If we consider each x-value to be the input that produces exactly one output, then we can use the notation

The notation reads “f of x” and should not be confused with multiplication. Most of our study of algebra involves functions, so the notation becomes very useful when performing common tasks. Functions can be named with different letters; some common names for functions are g(x), h(x), C(x), and R(x). First, consider nonvertical lines that we know can be expressed using slope-intercept form, . For any real numbers m and b, the equation defines a function, and we can replace y with the new notation as follows:

Therefore, a linear functionAny function that can be written in the form f(x) = mx + b. is any function that can be written in the form . In particular, we can write the following:

The notation also shows values to evaluate in the equation. If the value for x is given as 8, then we know that we can find the corresponding y-value by substituting 8 in for x and simplifying. Using function notation, this is denoted and can be interpreted as follows:

Finally, simplify:

We have . This notation tells us that when x = 8 (the input), the function results in 4 (the output).
Example 4: Given the linear function , find .
Solution: In this case, indicates that we should evaluate when .

Answer:
Example 5: Given the linear function , find x when .
Solution: In this case, indicates that the function should be set equal to 10.
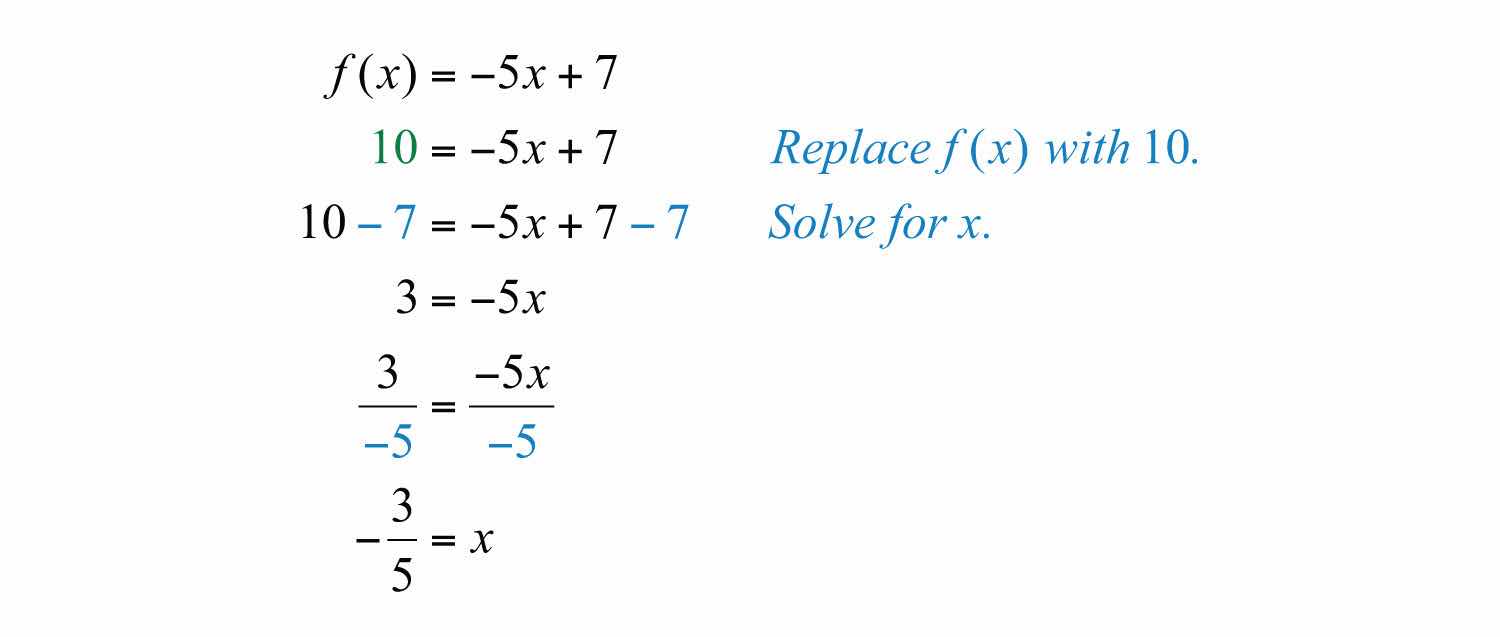
Answer: Here , and we can write .
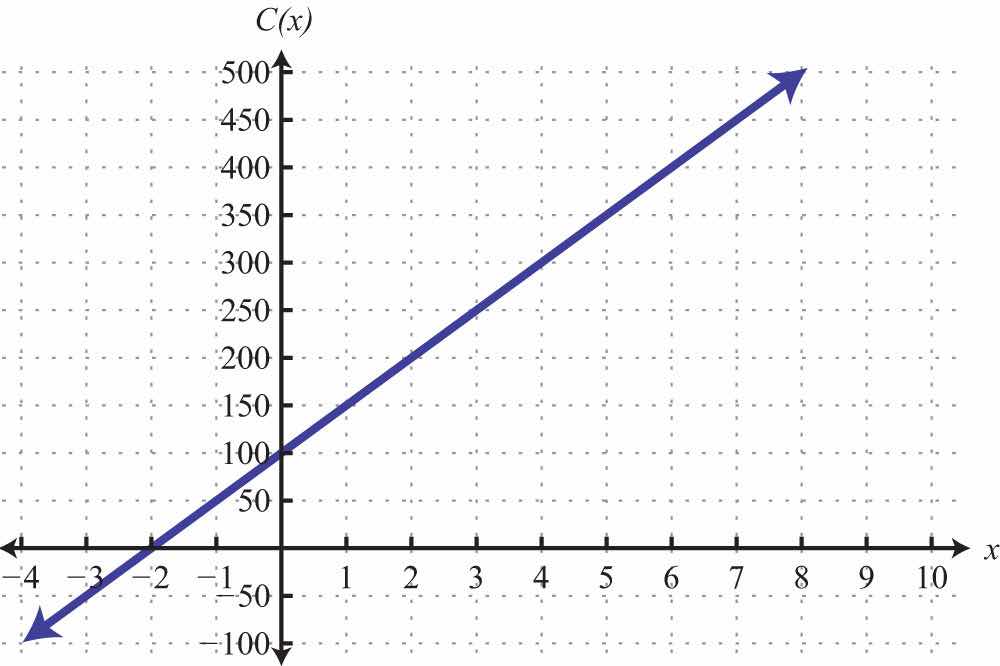
Example 6: Given the graph of a linear function ,
a. Find .
b. Find x when .
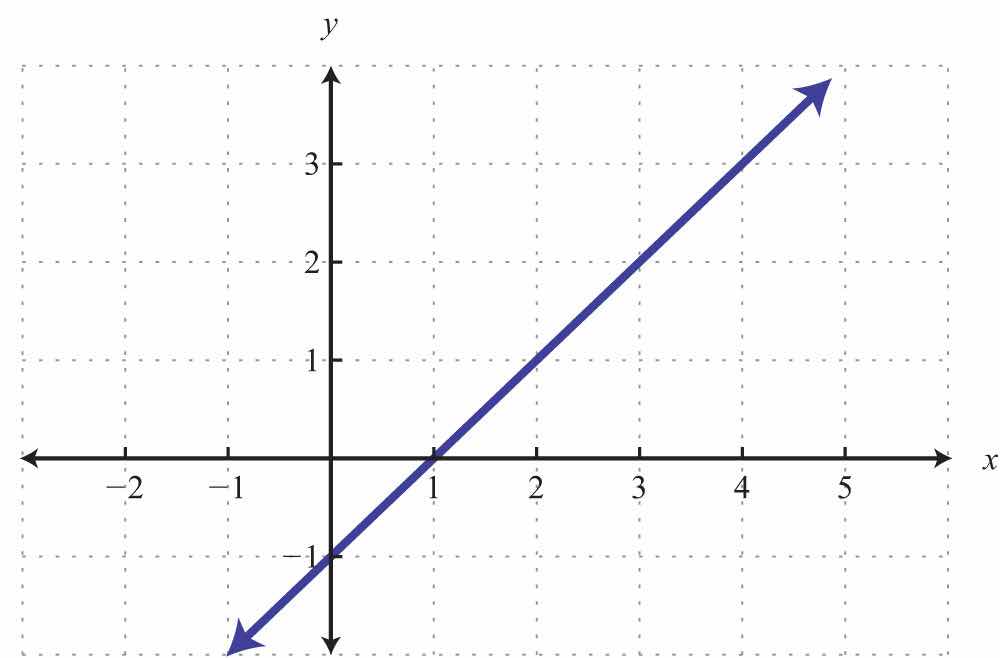
Solution:
a. The notation implies that x = 2. Use the graph to determine the corresponding y-value.
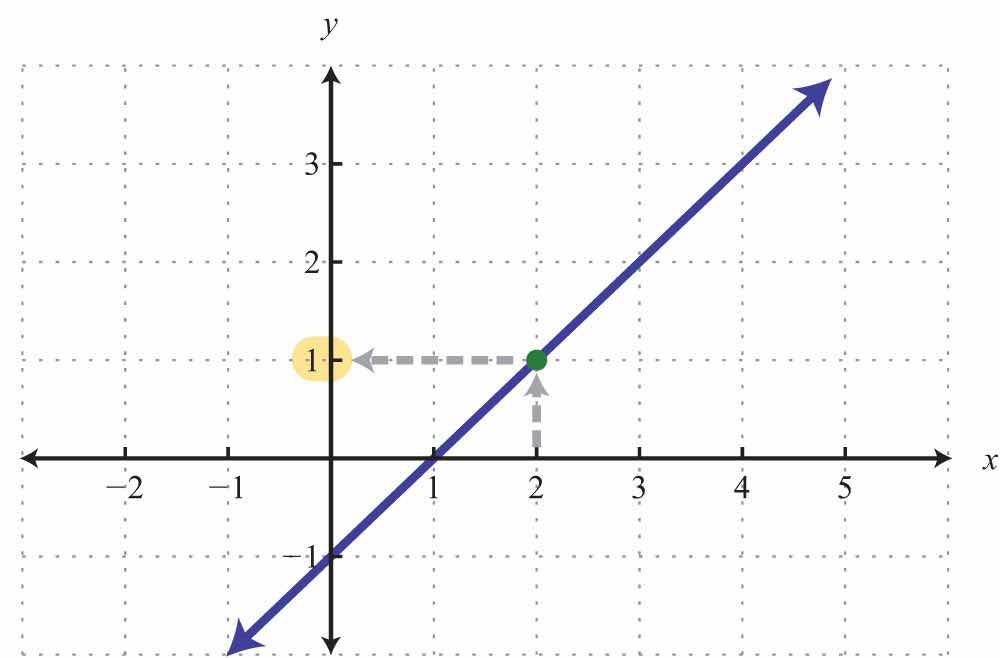
Answer:
b. The notation implies that the y-value is given as 3. Use the graph to determine the corresponding x-value.
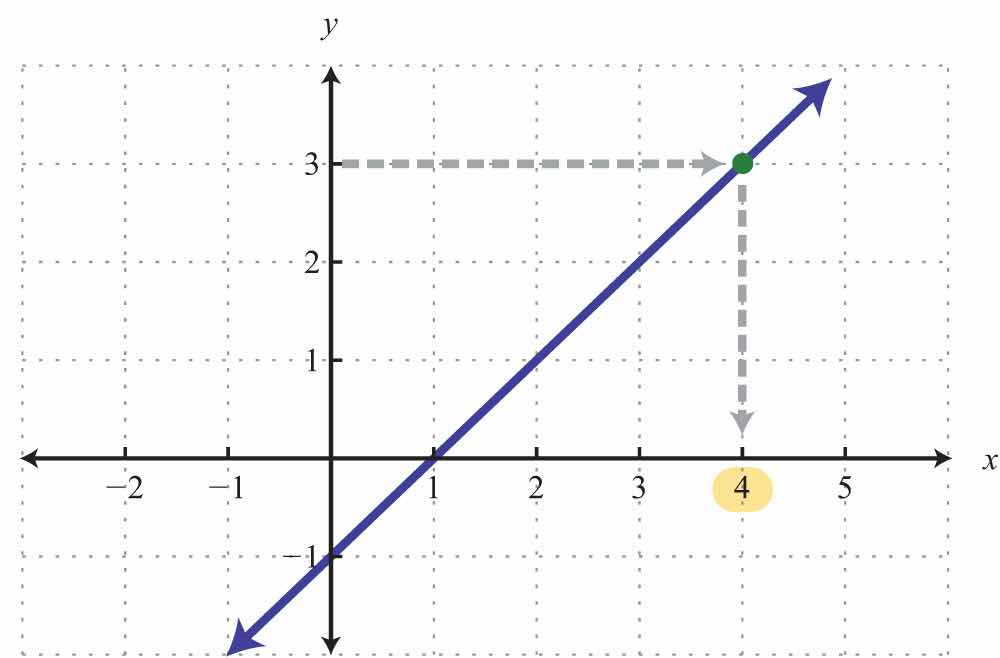
Answer: x = 4
Example 7: Graph the linear function and state the domain and range.
Solution: From the function, we see that b = 6 and thus the y-intercept is (0, 6). Also, we can see that the slope is . Starting from the y-intercept, mark a second point down 5 units and right 3 units.
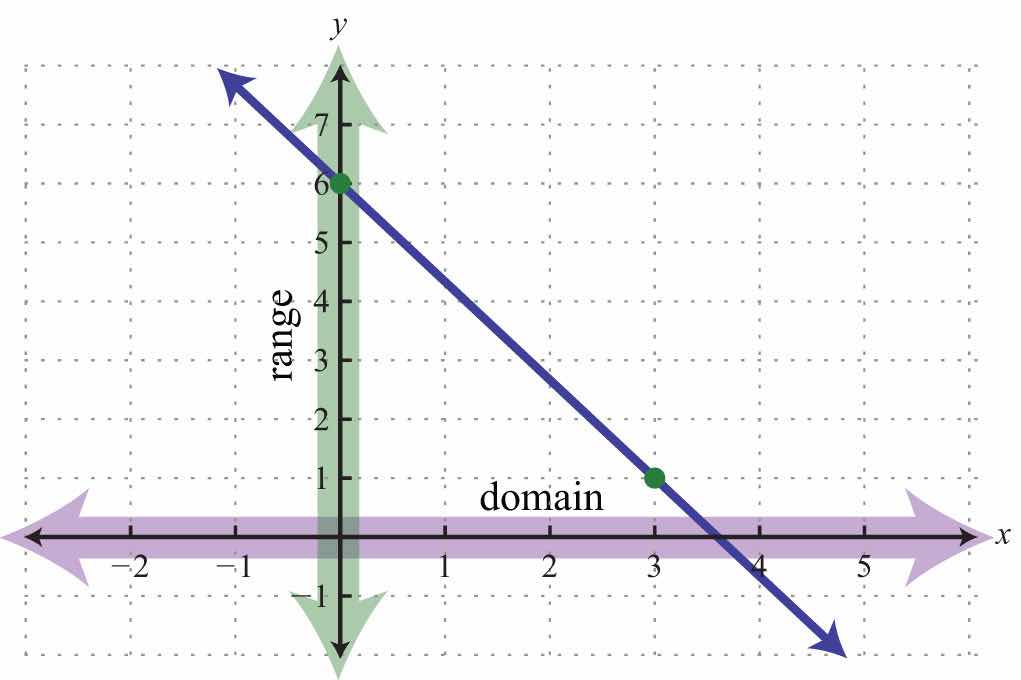
Given any coordinate on the x-axis, we can find a corresponding point on the graph; the domain consists of all real numbers. Also, for any coordinate on the y-axis, we can find a point on the graph; the range consists of all real numbers.
Answer: Both the domain and range consist of all real numbers R.
Try this! Given the linear function ,
a. Find .
b. Find x when .
Answers:
a.
b.
Any nonvertical or nonhorizontal line is a function and can be written using function notation . Both the domain and range consist of all real numbers.
Part A: Functions
For each problem below, does the correspondence represent a function?
1. Algebra students to their scores on the first exam.
2. Family members to their ages.
3. Lab computers to their users.
4. Students to the schools they have attended.
5. People to their citizenships.
6. Local businesses to their number of employees.
Determine the domain and range and state whether the relation is a function or not.
7. {(3, 2), (5, 3), (7, 4)}
8. {(−5, −3), (0, 0), (5, 0)}
9. {(−10, 2), (−8, 1), (−8, 0)}
10. {(9, 12), (6, 6), (6, 3)}
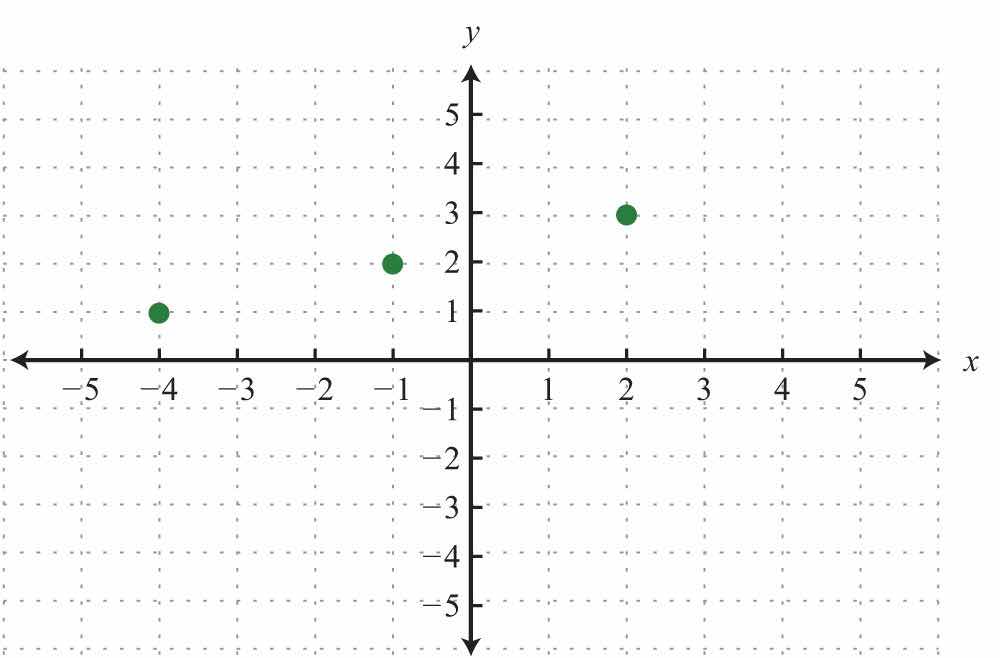
11.
12.
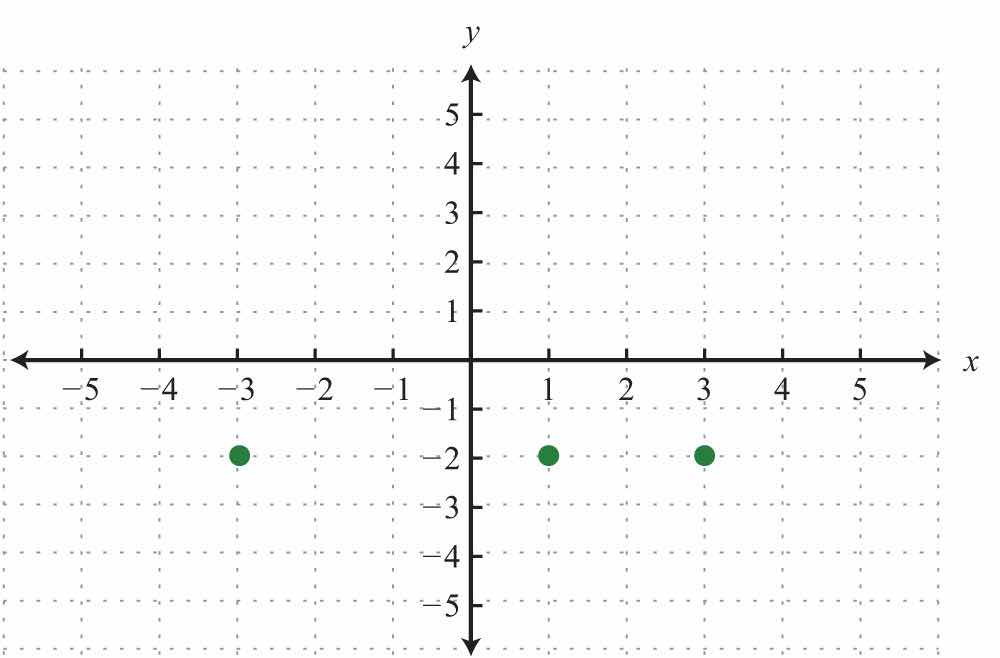
13.
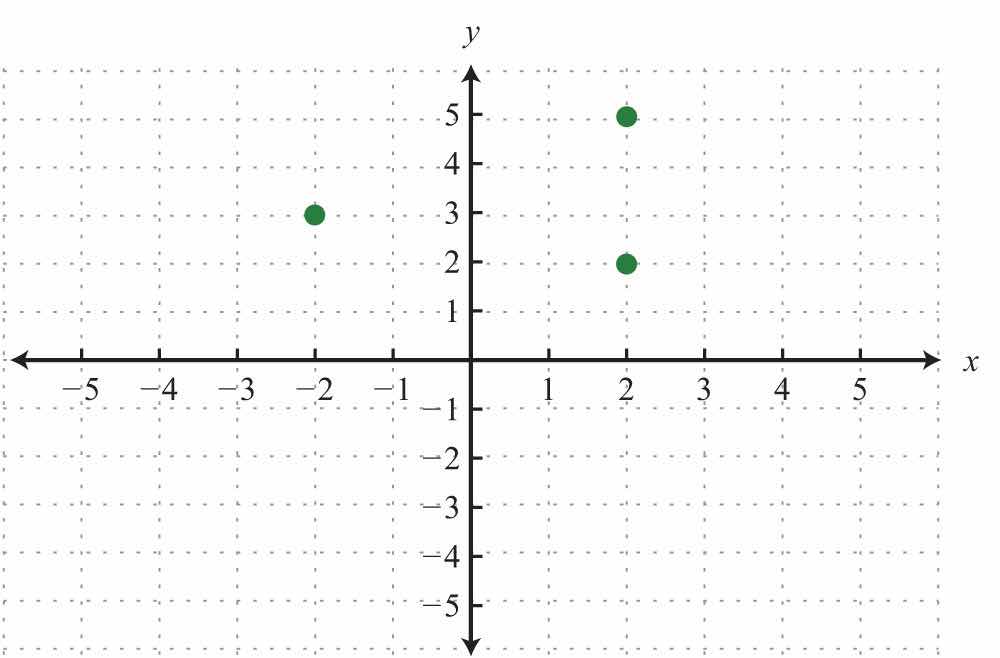
14.
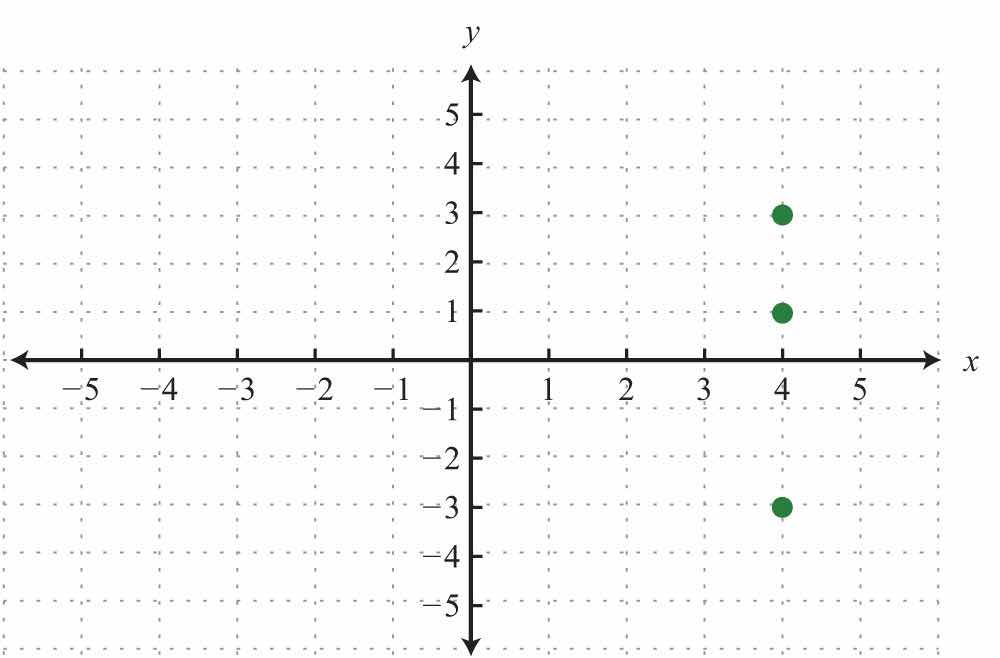
15.
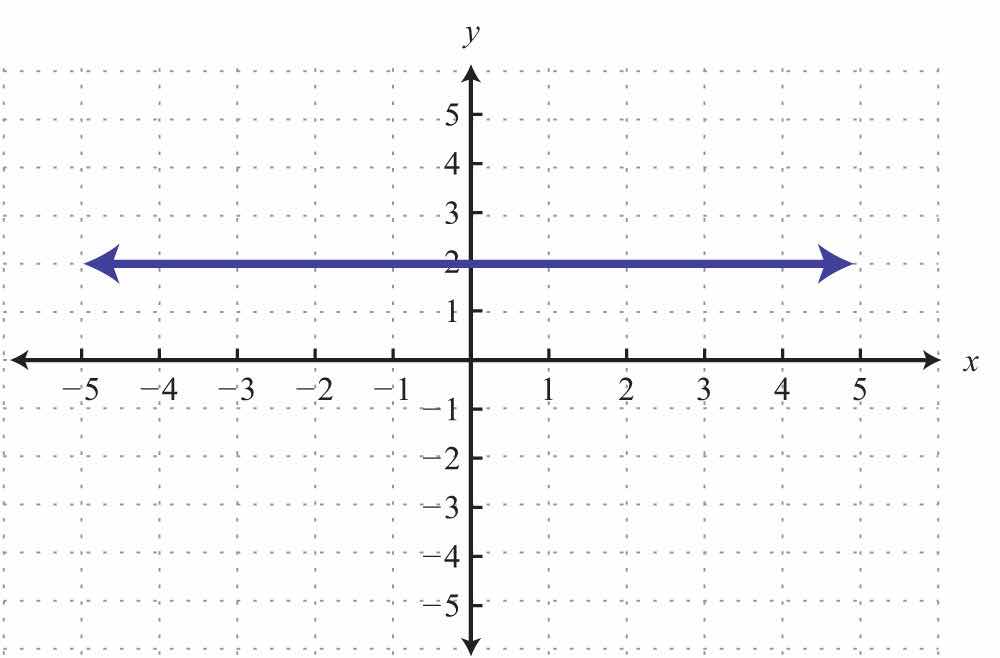
16.
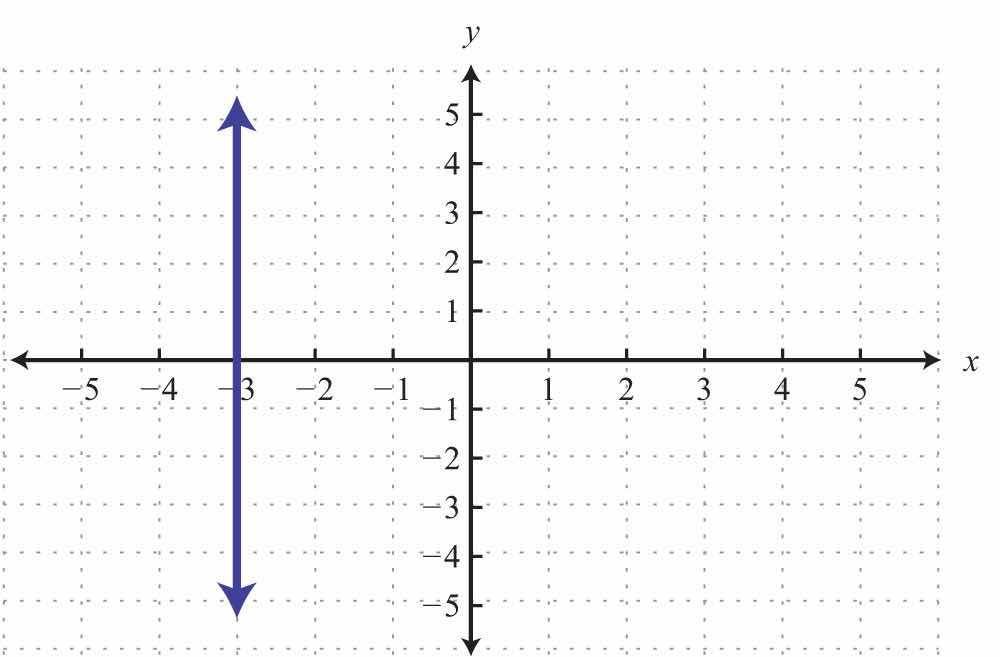
17.
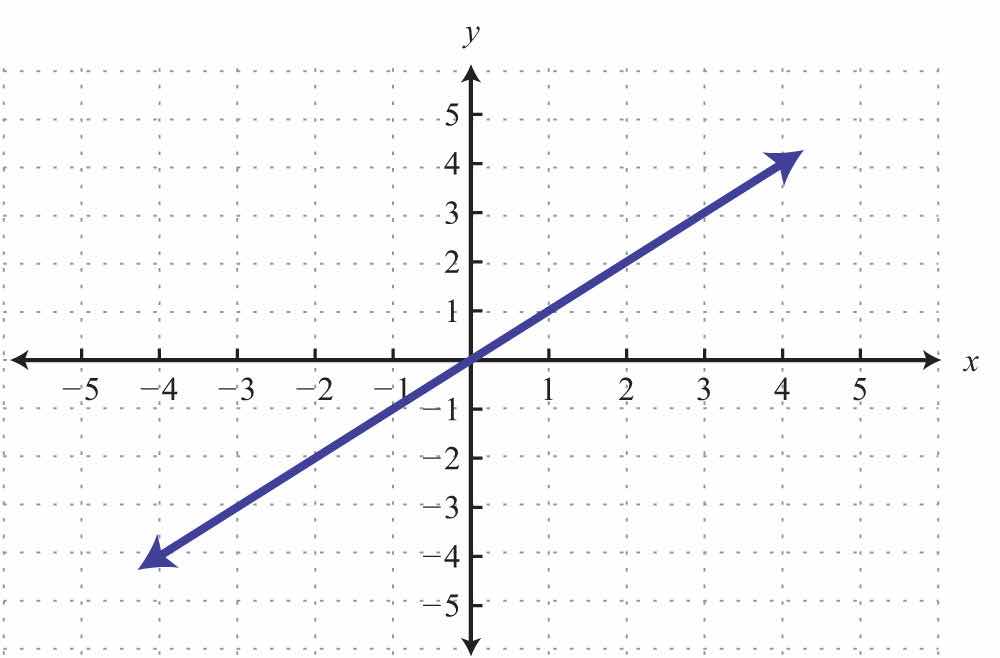
18.
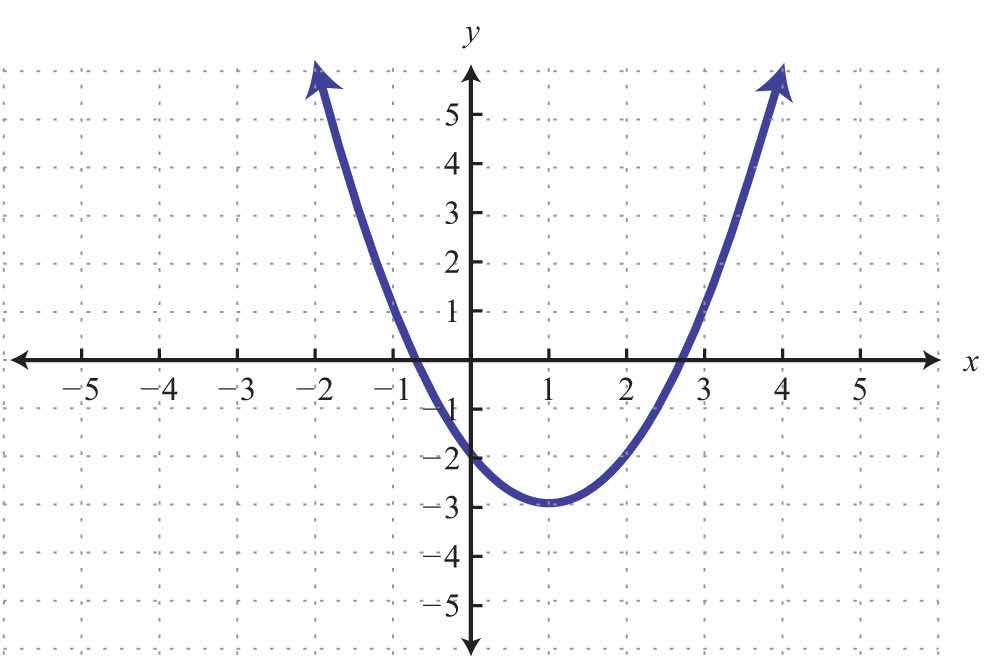
19.
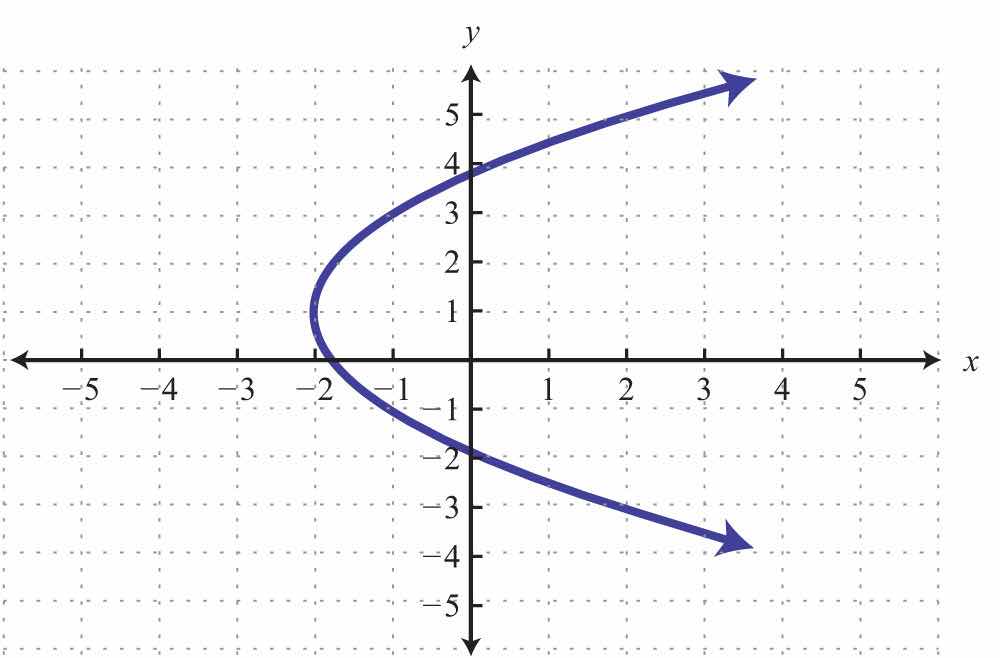
20.
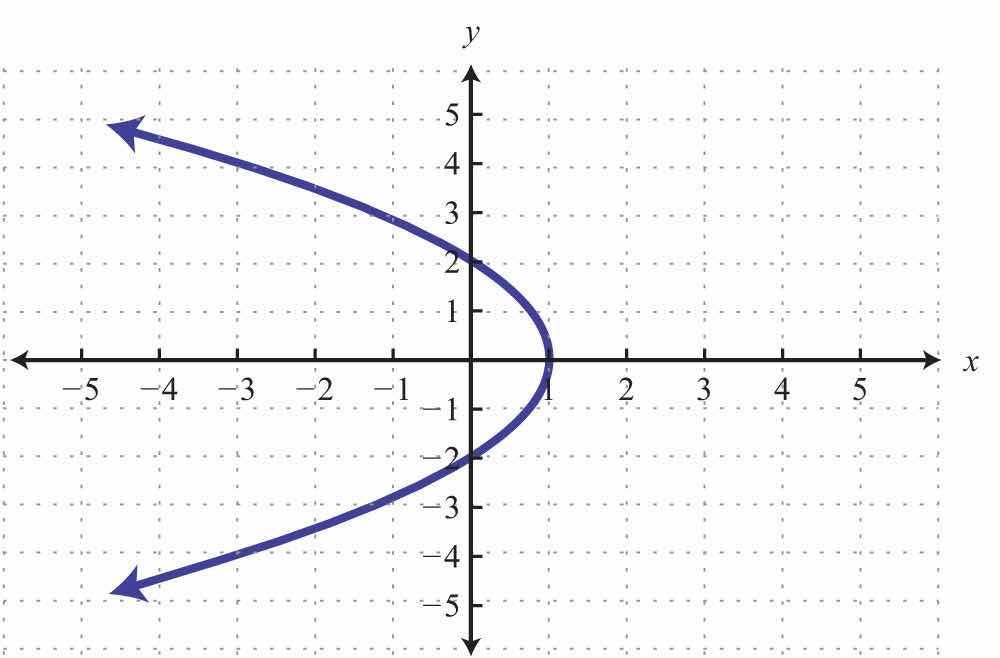
21.
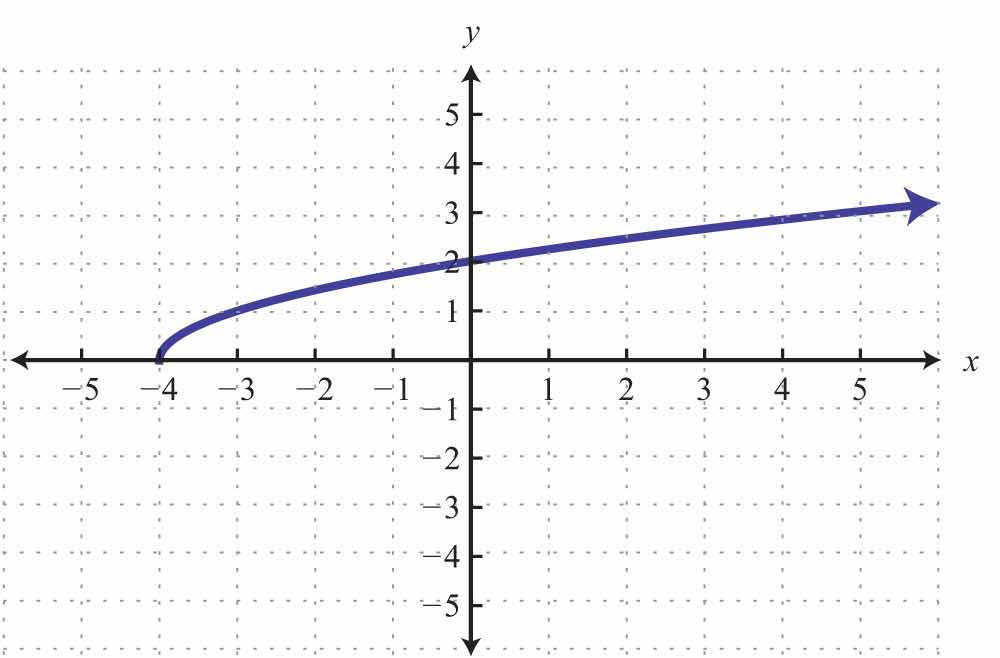
22.
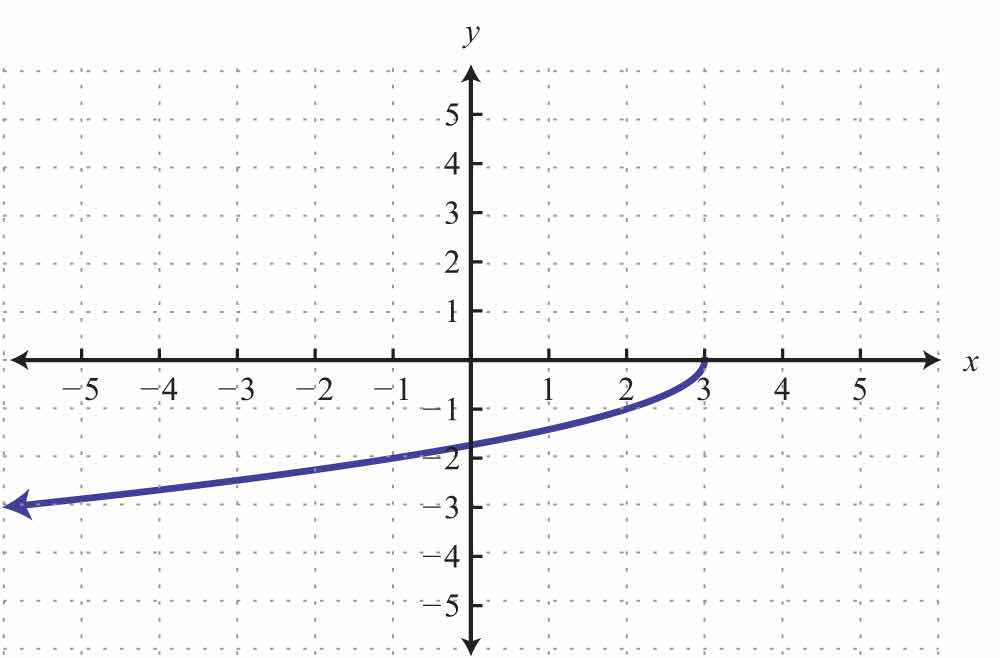
23.
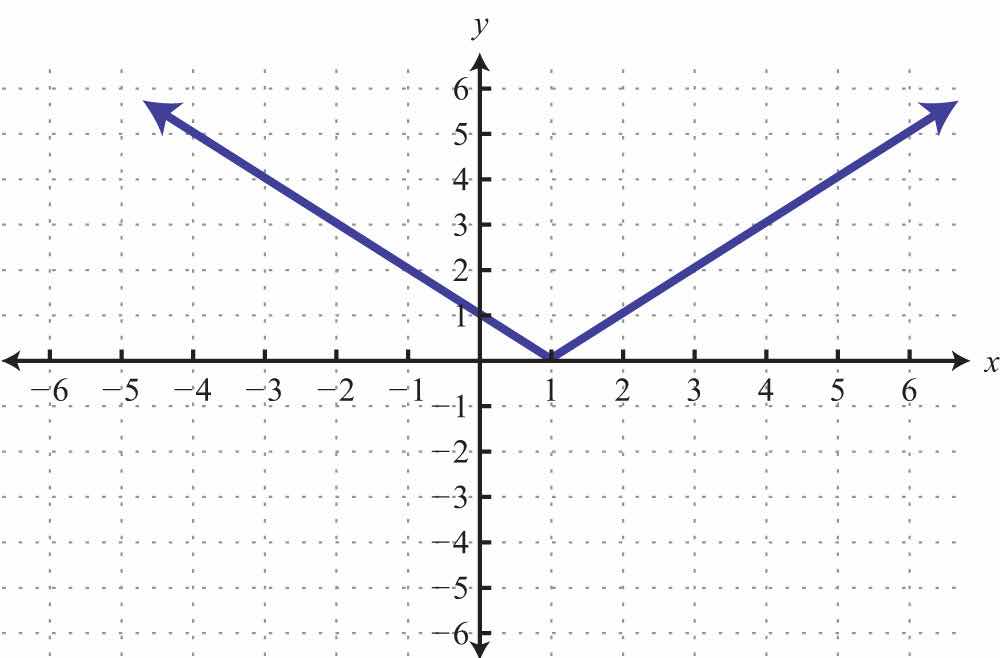
24.
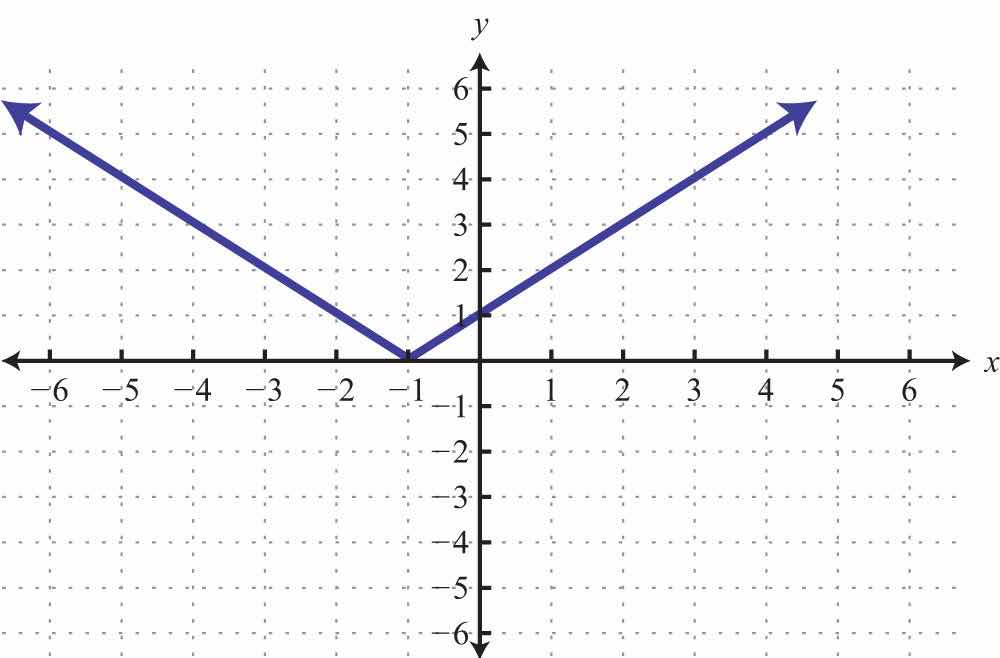
25.
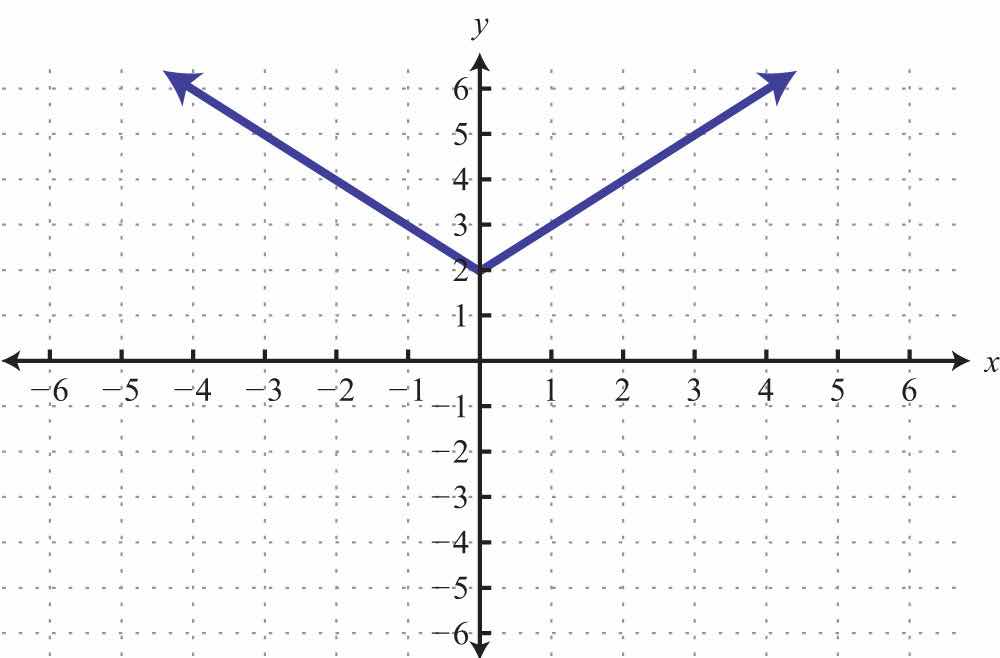
26.
Part B: Function Notation
Given the following functions, find the function values.
27. , find .
28. , find .
29. , find .
30. , find .
31. , find .
32. , find .
33. , find .
34. , find .
35. , find .
36. , find .
37. , find x when .
38. , find x when .
39. , find x when .
40. , find x when .
41. , find x when .
42. , find x when .
43. , find x when .
44. , find x when .
Given and calculate the following.
45.
46.
47.
48.
49.
50.
51.
52.
53. Find x when .
54. Find x when .
55. Find x when .
56. Find x when .
Given the graph, find the function values.
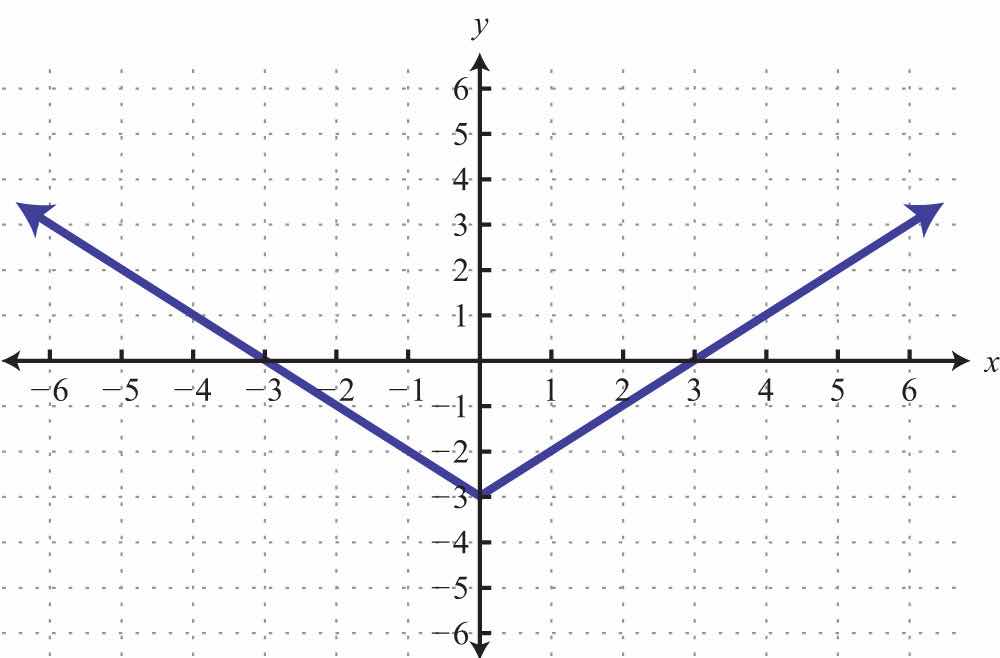
57. Given the graph of , find , , , and .
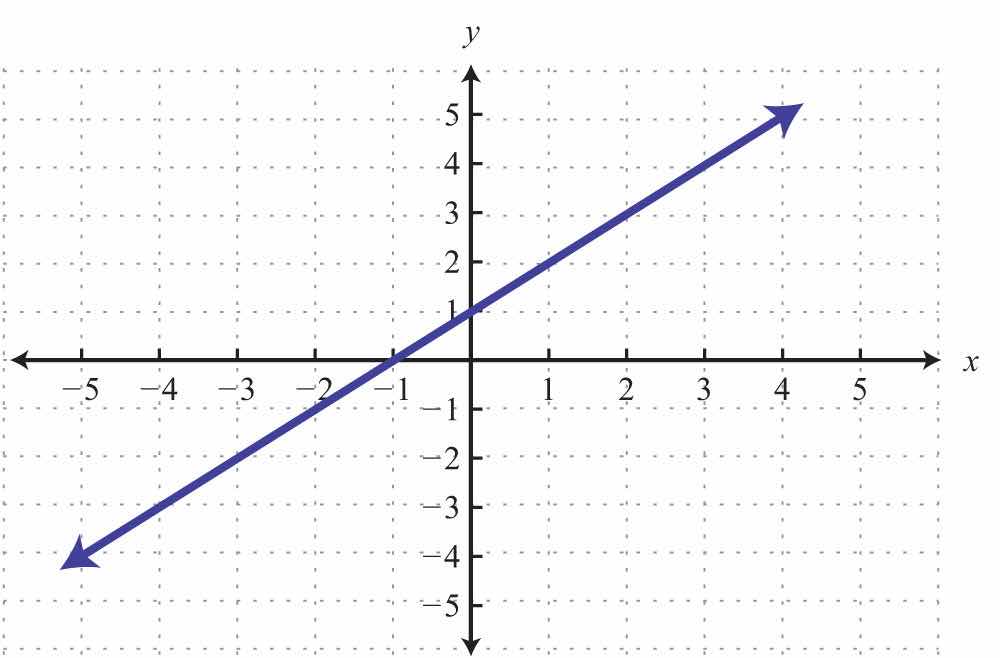
58. Given the graph of , find , , , and .
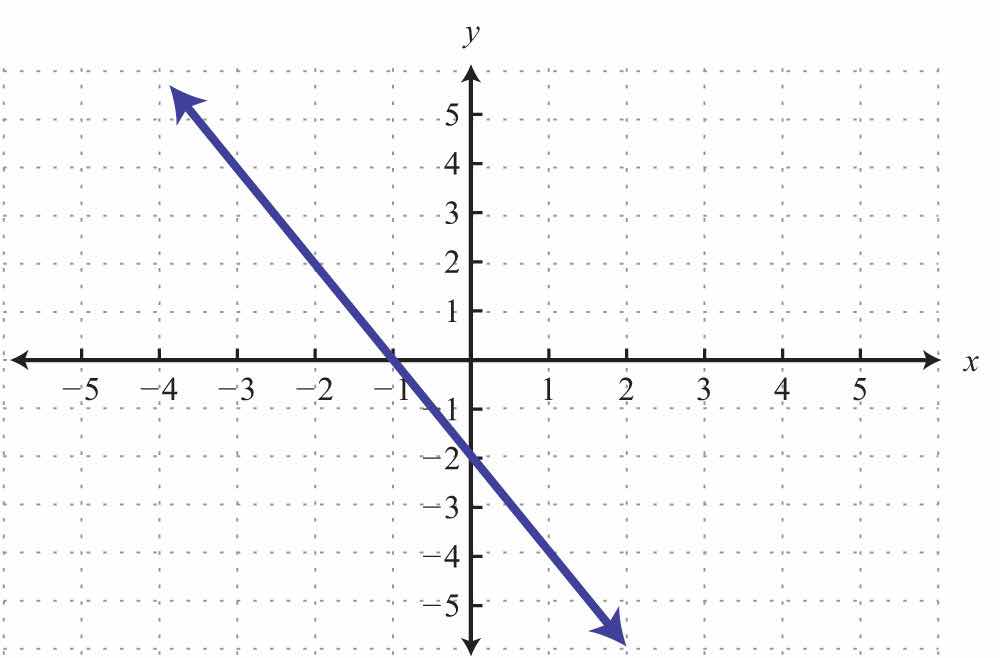
59. Given the graph of , find , , , and .
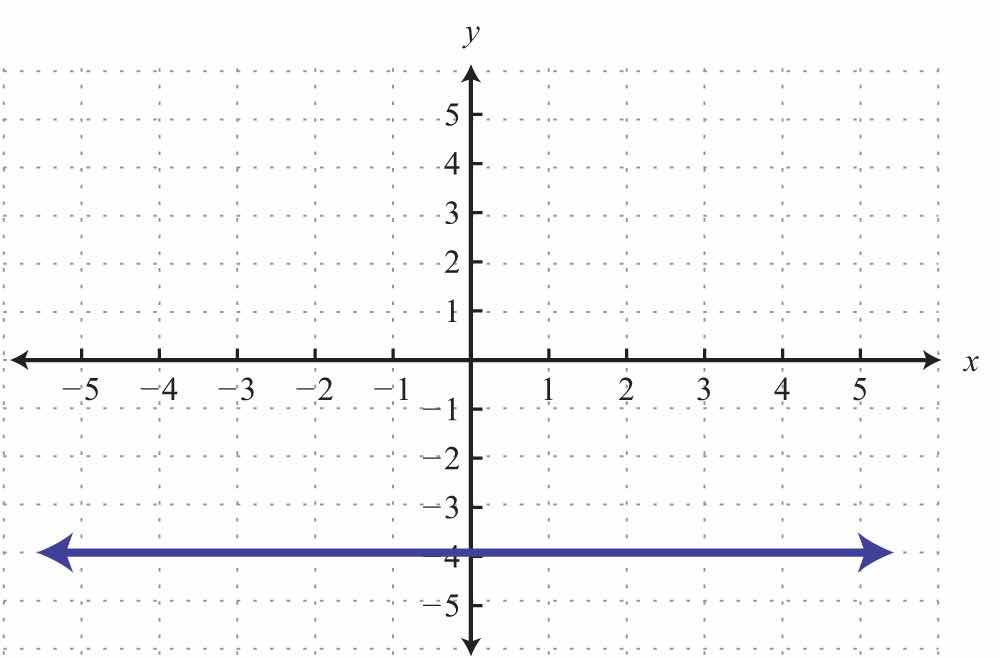
60. Given the graph of , find , , , and .
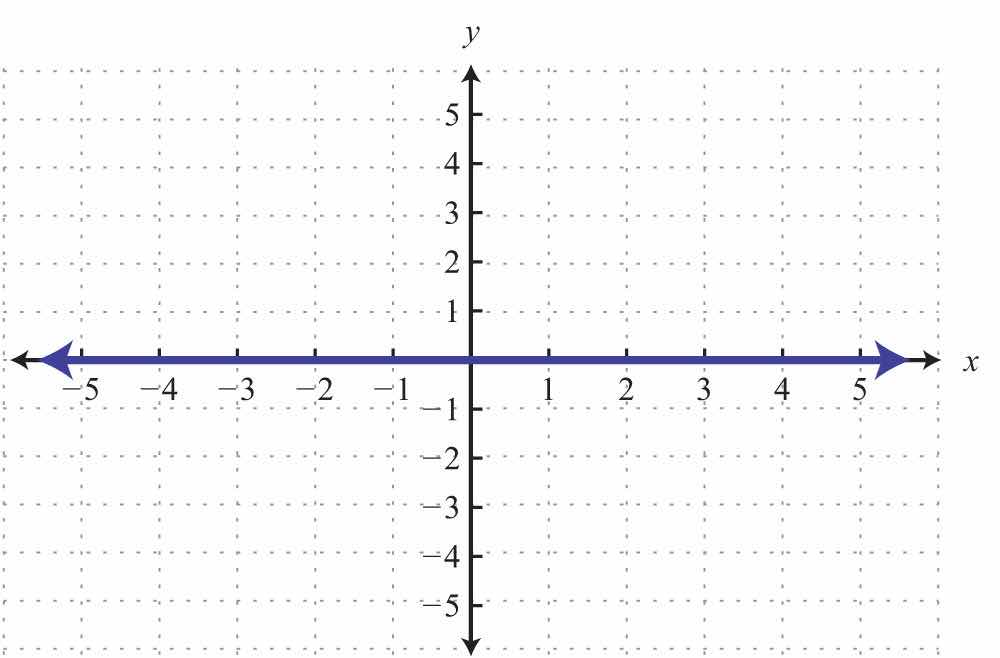
61. Given the graph of , find , , , and .

62. Given the graph of , find , , , and .
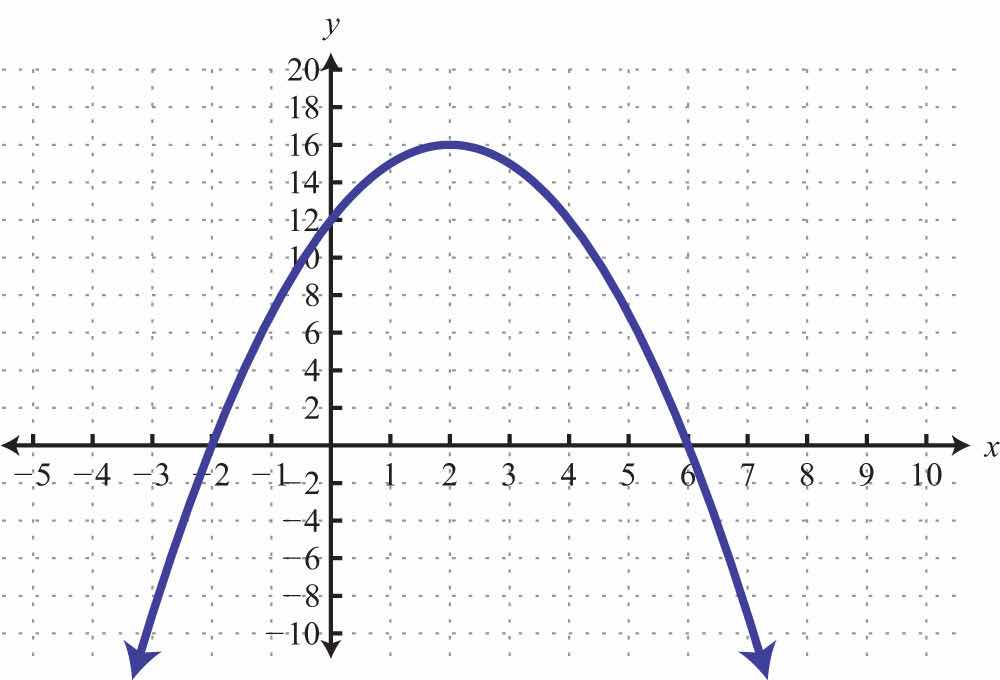
63. Given the graph of , find , , , and .

64. Given the graph of , find , , , and .

Given the graph, find the x-values.
65. Given the graph of , find x when , , and .
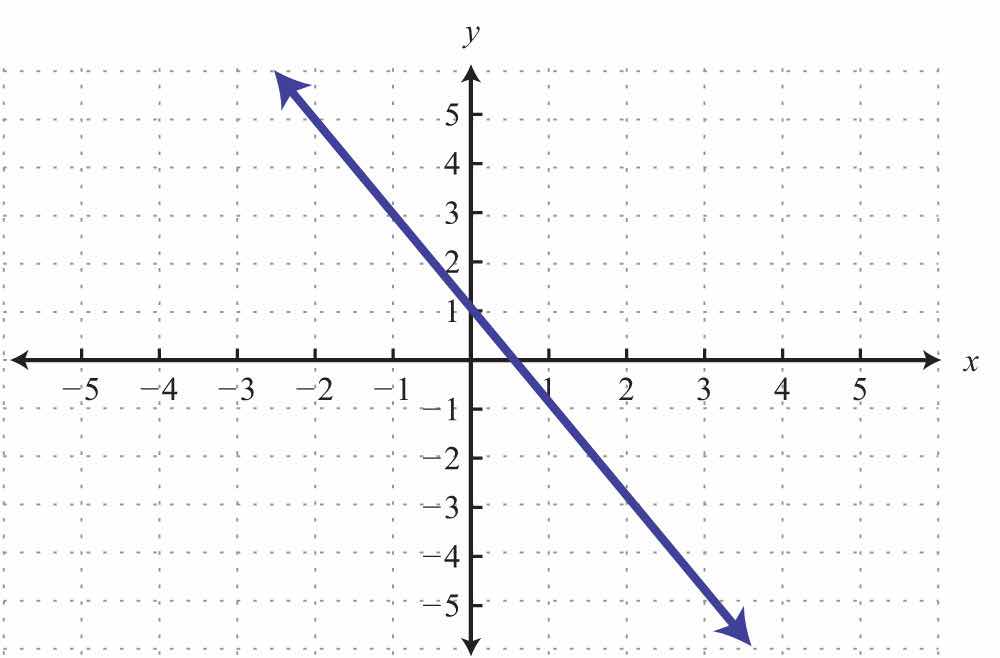
66. Given the graph of , find x when , , and .
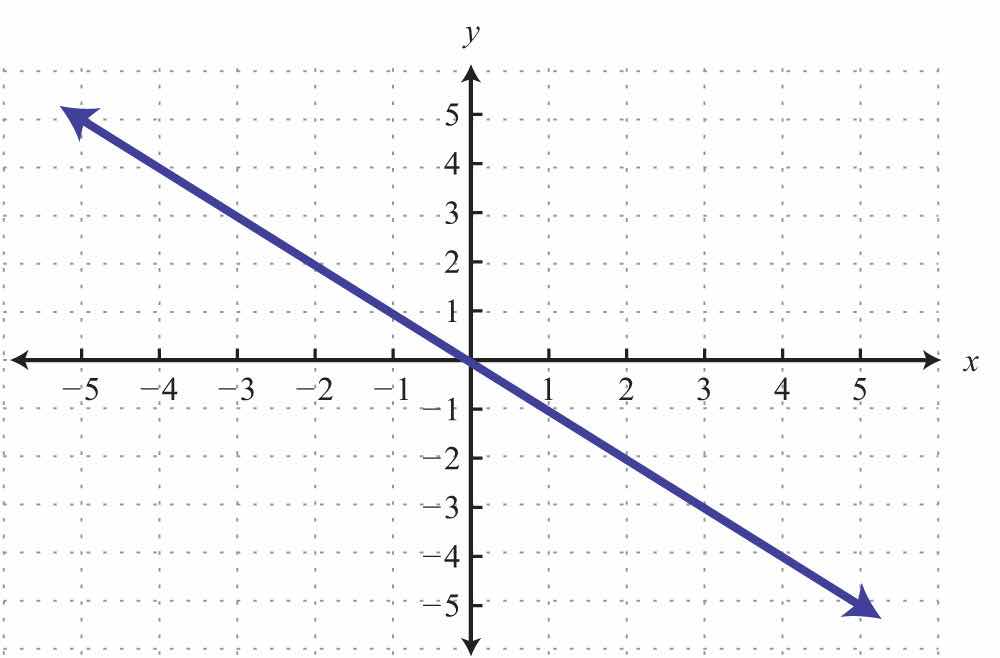
67. Given the graph of , find x when .
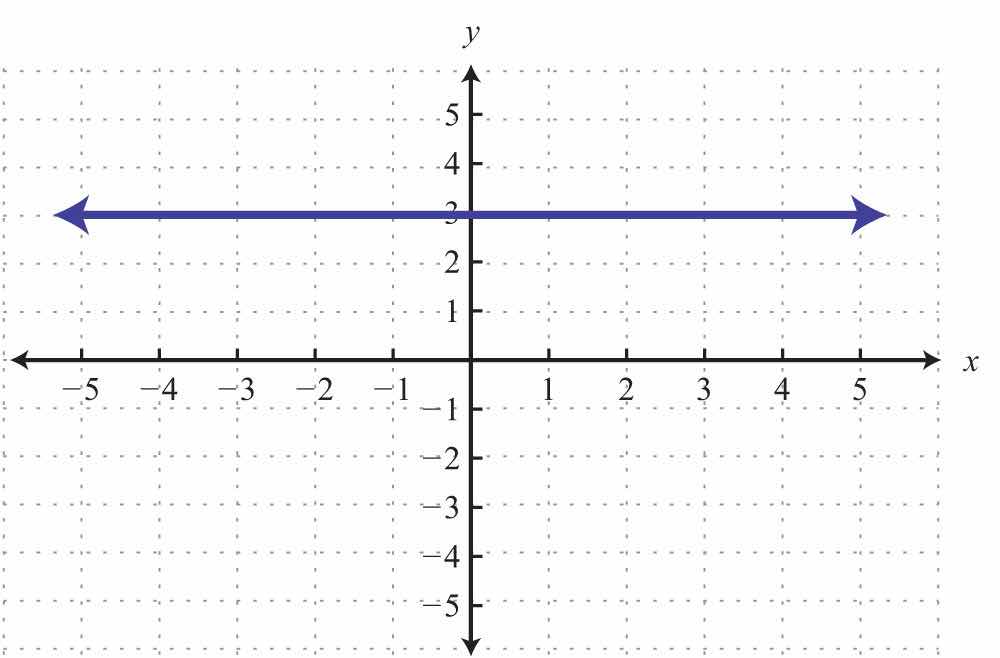
68. Given the graph of , find x when , , and .
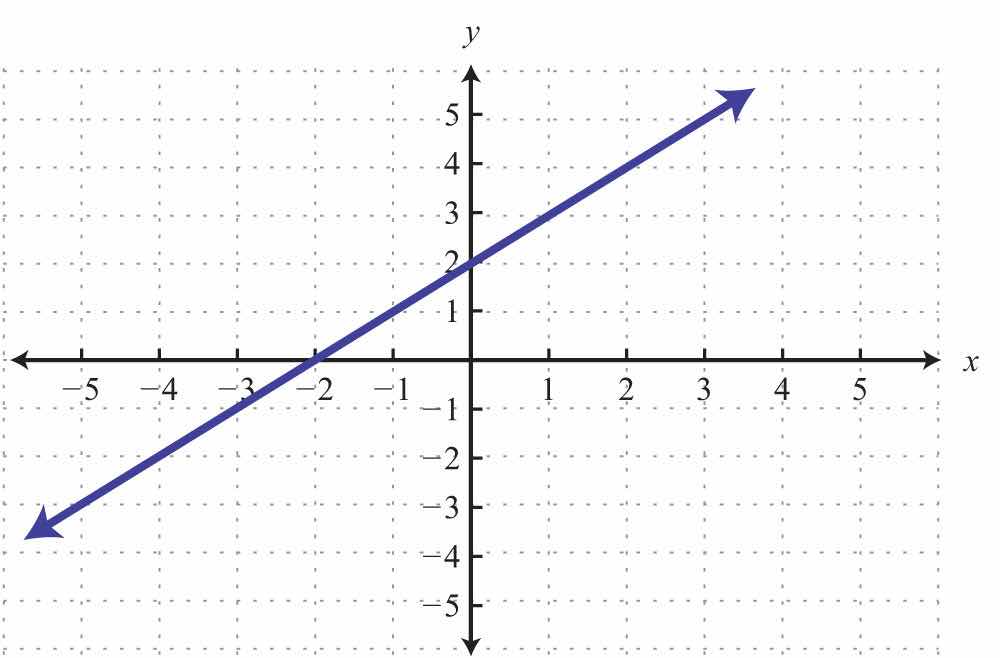
69. Given the graph of , find x when , , and .
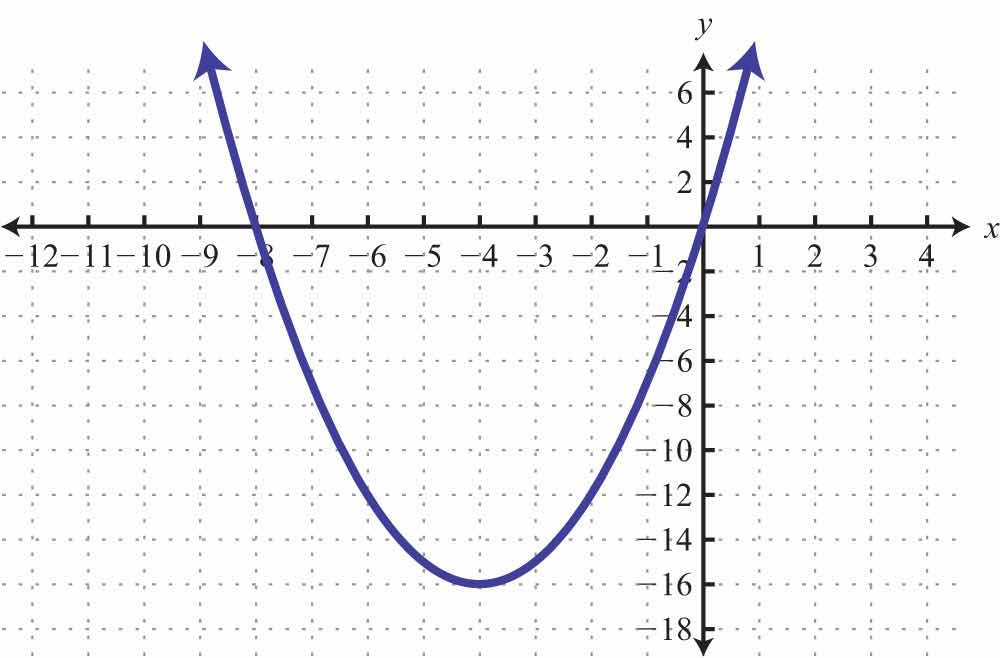
70. Given the graph of , find x when , , and .
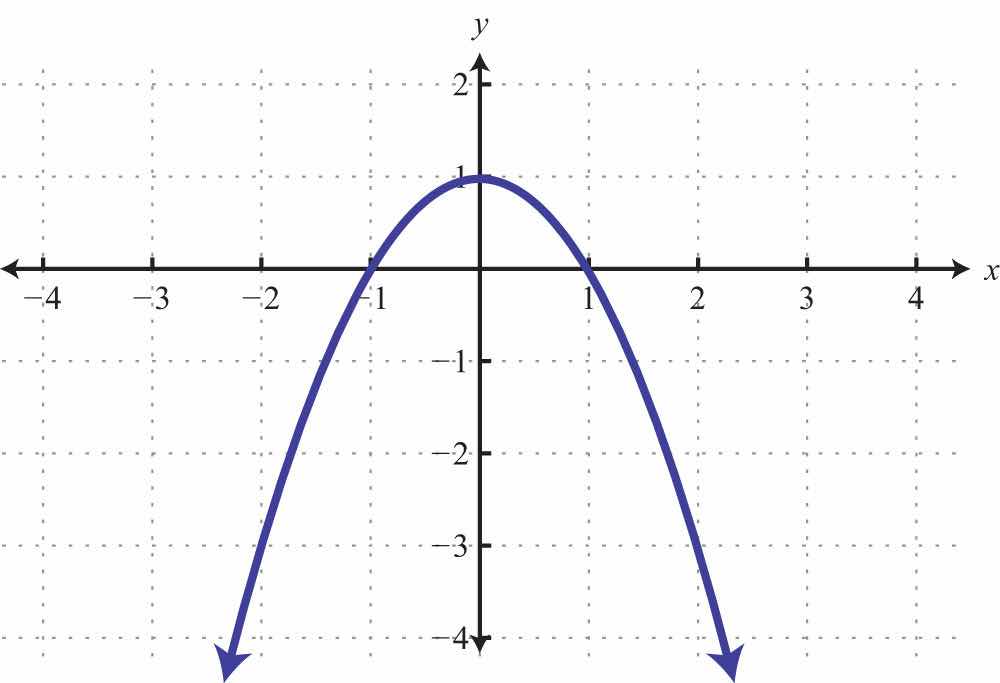
71. Given the graph of , find x when , , and .
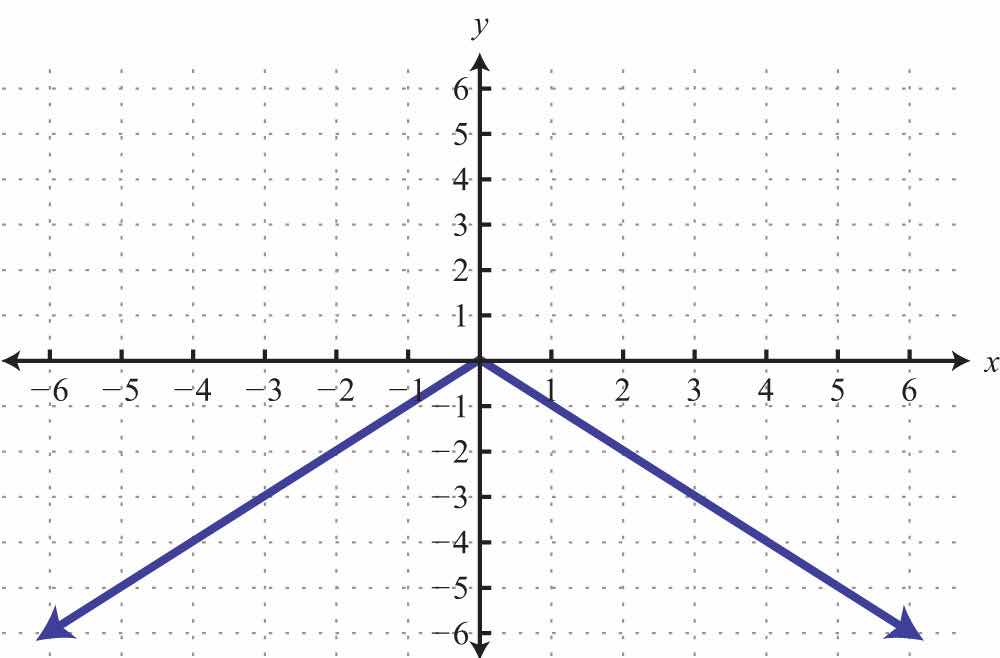
72. Given the graph of , find x when , , and .
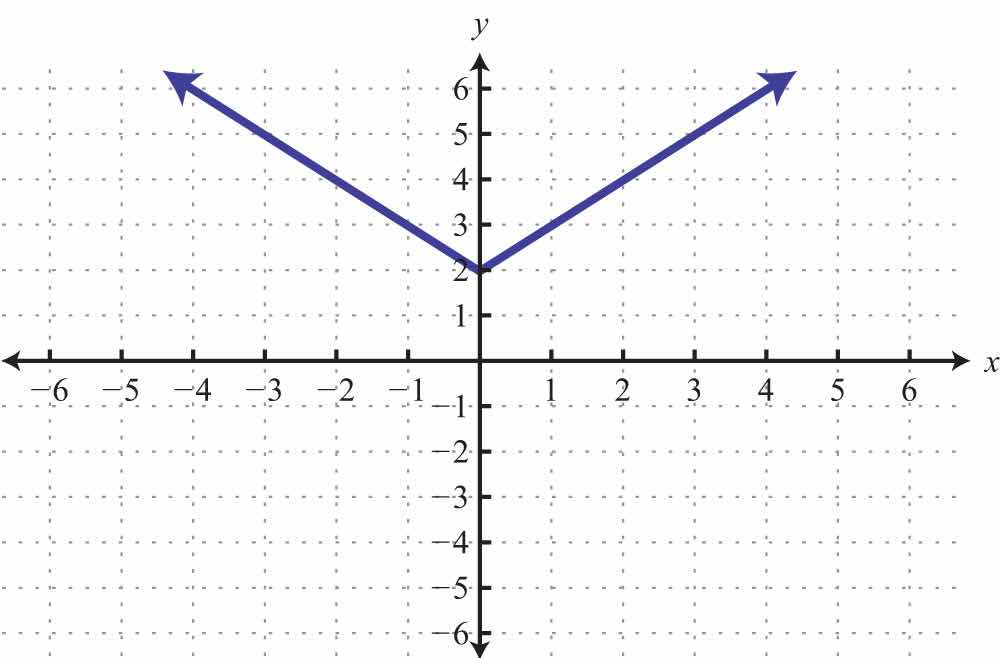
73. The cost in dollars of producing pens with a company logo is given by the function where x is the number of pens produced. Use the function to calculate the cost of producing 200 pens.
74. The revenue in dollars from selling sweat shirts is given by the function , where x is the number of sweat shirts sold. Use the function to determine the revenue if 20 sweat shirts are sold.
75. The value of a new car in dollars is given by the function , where t represents the age of the car in years. Use the function to determine the value of the car when it is 5 years old. What was the value of the car when new?
76. The monthly income in dollars of a commissioned car salesman is given by the function , where n represents the number of cars sold in the month. Use the function to determine the salesman’s monthly income if he sells 3 cars this month. What is his income if he does not sell any cars in a month?
77. The perimeter of an isosceles triangle with a base measuring 10 centimeters is given by the function , where x represents the length of each of the equal sides. Find the length of each side if the perimeter is 40 centimeters.
78. The perimeter of a square depends on the length of each side s and is modeled by the function . If the perimeter of a square measures 140 meters, then use the function to calculate the length of each side.
79. A certain cellular phone plan charges $18 per month and $0.10 per minute of usage. The cost of the plan is modeled by the function , where x represents the number of minutes of usage per month. Determine the minutes of usage if the cost for the month was $36.
80. The monthly revenue generated by selling subscriptions to a tutoring website is given by the function , where x represents the number of subscription sales per month. How many subscriptions were sold if the revenues for the month totaled $1,508?
Graph the linear function and state the domain and range.
81.
82.
83.
84.
85.
86.
87.
88.
Part C: Discussion Board Topics
89. Is a vertical line a function? What are the domain and range of a vertical line?
90. Is a horizontal line a function? What are the domain and range of a horizontal line?
91. Come up with your own correspondence between real-world sets. Explain why it does or does not represent a function.
92. Can a function have more than one y-intercept? Explain.
1: Yes
3: No
5: No
7: Domain: {3, 5, 7}; range: {2, 3, 4}; function: yes
9: Domain: {−10,−8}; range: {0, 1, 2}; function: no
11: Domain: {−4, −1, 2}; range: {1, 2, 3}; function: yes
13: Domain: {−2, 2}; range: {2, 3, 5}; function: no
15: Domain: ; range: {2}; function: yes
17: Domain: ; range: ; function: yes
19: Domain: ; range: ; function: no
21: Domain: ; range: ; function: yes
23: Domain: ; range: ; function: yes
25: Domain: ; range: ; function: yes
27:
29:
31:
33:
35:
37:
39:
41:
43:
45:
47:
49:
51:
53:
55:
57: , , , and
59: , , , and
61: , , , and
63: , , , and
65: , , and
67: (answers may vary)
69: ; and ; and
71: and ; ; and
73: $450
75: New: $18,000; 5 years old: $5,500
77: 15 centimeters
79: 180 minutes
81: Domain and range: R
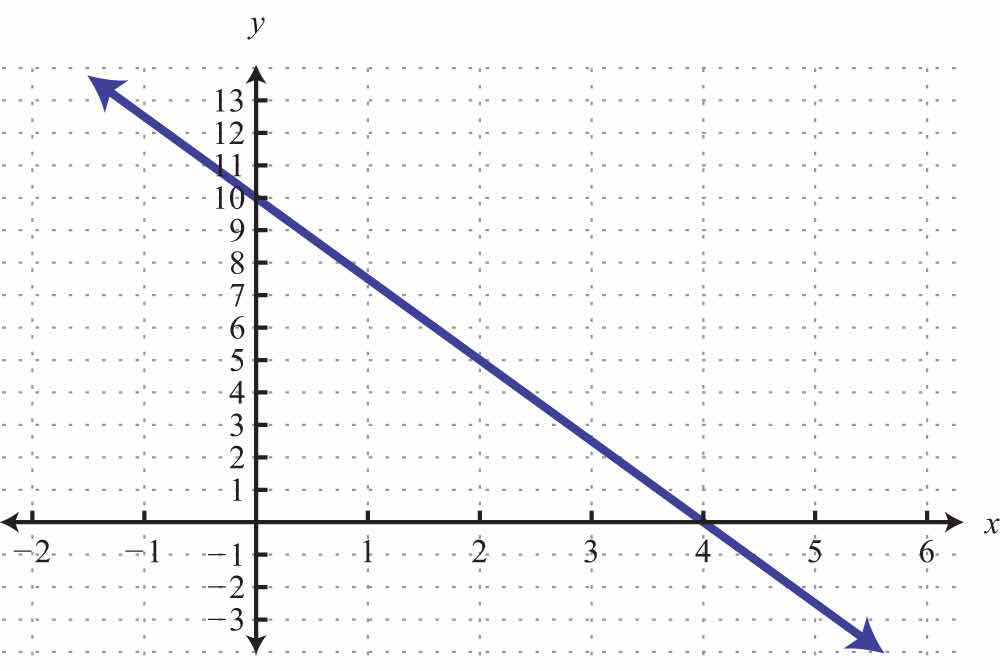
83: Domain and range: R
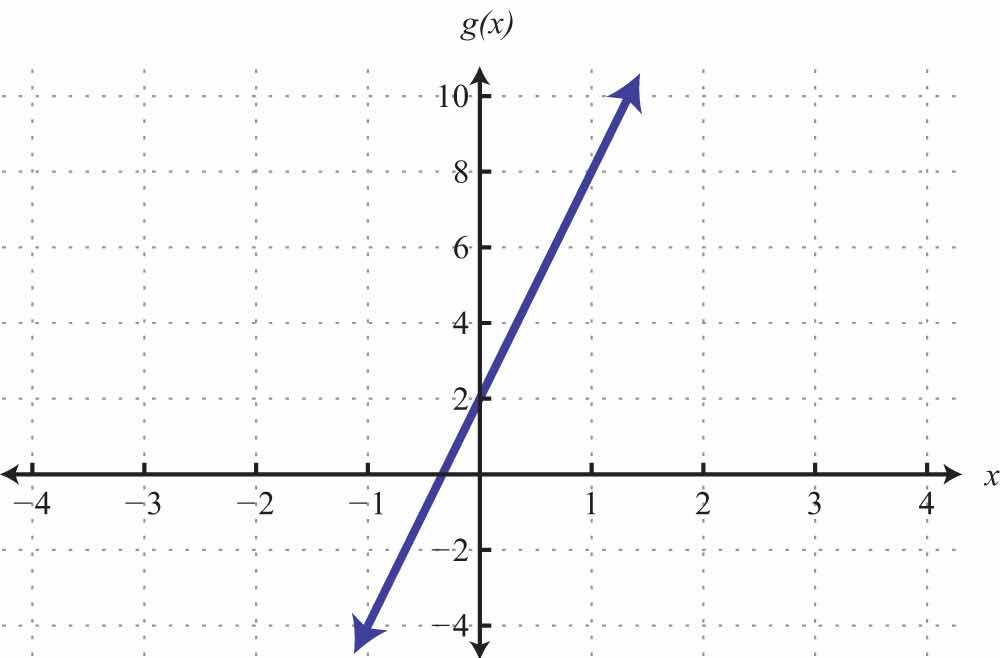
85: Domain and range R
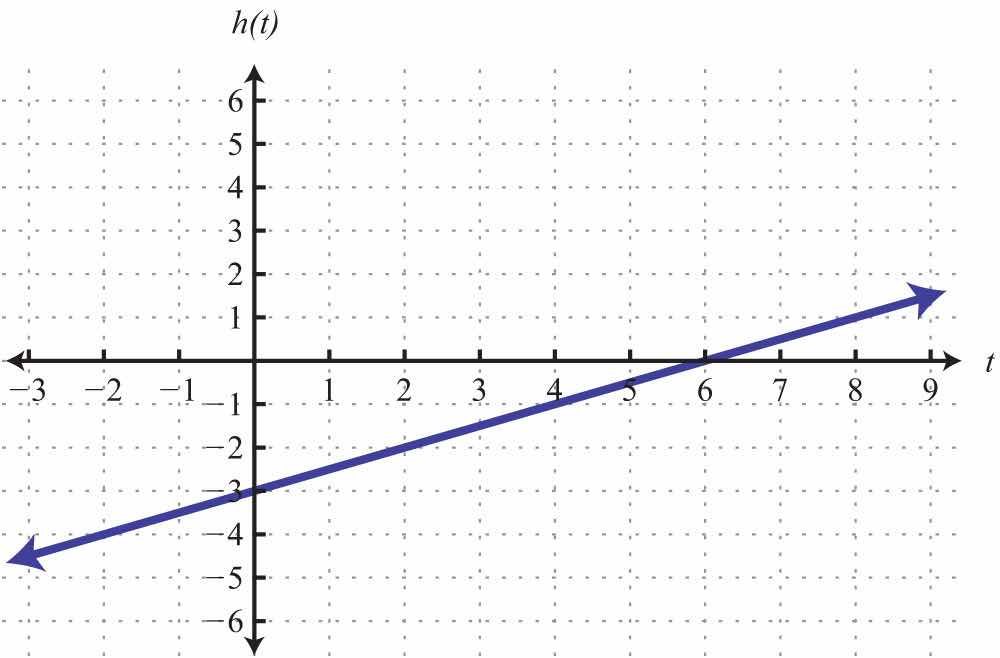
87: Domain and range: R
