How to Graph an Absolute Value and Do Transformations - Answers
The answers are in BOLD below.
NOTE: The transcript from the video is listed below the quiz for your reference.
1. A transformation that shifts the graph up/down or left/right is called a...
Resizing
Rotation
Reflection
Dilation
Translation
2. What would the coordinates of the vertex be of the graph y=|x-9|-2?
Not enough information
(-9,-2)
(9,-2)
(-9,2)
(9,2)
3.
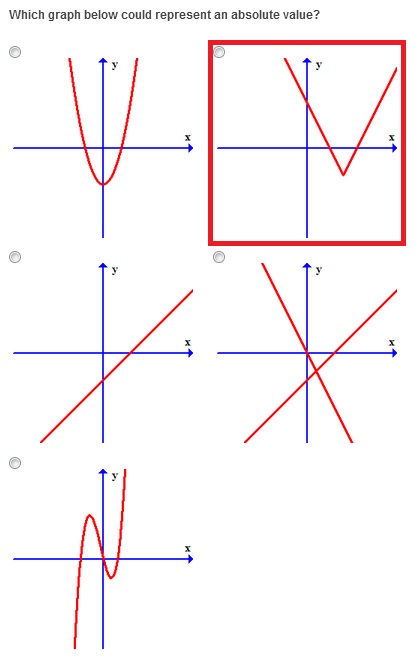
4.
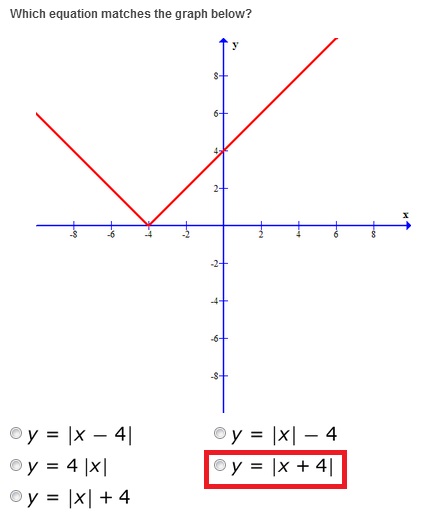
5.
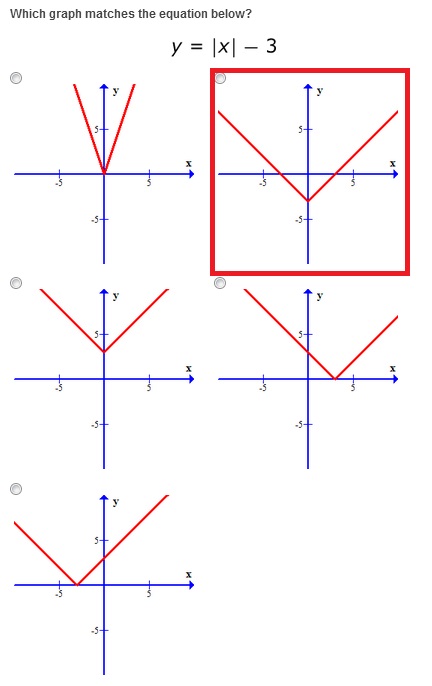
Absolute value graphs normally look like the letter 'V', but transformations can change that 'V' in a number of different ways. As well as teaching you how to graph absolute values, this video will focus on a specific group of transformations called translations. Learn all about what that means here!
Standard Graphs and Absolute Value Graphs
When you're learning something new, it can often help to first compare the new idea with one that you already know. By turning something that looks completely new and different into something that's only a little twist on a concept you already know, there becomes way less stuff to remember and it makes it way easier to learn. So before we jump straight into graphing y=|x|, let's first take a look at a graph we already know, y=x.
If we wanted to practice our slope-intercept form skills, y=x would basically be y=1x+0, which means the graph begins at 0 and goes up one, over one because that is our slope, and we get a punch of points that are in a row to give us our line. We could also easily just make a table of values where all the numbers are exactly the same in each row for x and y and we would put a bunch of points on our graph and end up with the exact same line.
 |
Parts of an Absolute Value Graph
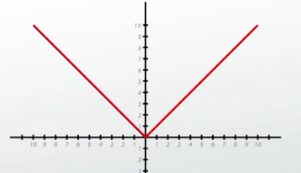
So now that we have y=x, lets start to think about how y=|x| is any different. Well, we know that absolute values don't change positive numbers, they just stay positive. That means that as long as we're substituting in positive x values (the right hand part of the graph), the absolute value doesn't do anything, and y=|x| is basically the same as y=x, so this right-hand part of the graph isn't going to be changed. But the absolute value does turn negative numbers back into positive ones. So instead of putting in -1 and getting out -1, we put in -1 and get out +1. -2 turns into +2, -3 turns into +3 and so on. So all of the graph of y=x that was under the y-axis now gets reflected back above the y-axis, almost as if there were a mirror right on the y-axis that doesn't allow the line to go below it, and what we end up with is a graph that looks like the letter V. The bottom of the V is at the origin, (0,0) and is called the vertex of the absolute value graph.
All absolute value graphs more or less look like this, the letter V. As a side-note, because I'm a music fan, I remember this by telling myself that the absolute coolest guitar is the Gibson Flying V. Maybe you can come up with a different analogy to help you remember, but that's what works for me. Anyway, all these graphs look like Vs, except we can mess around with them to shift them, or flip them, or make them fatter or skinnier. All these different things we can do are called transformations.
 |
Translating Horizontally and Vertically
We'll get to some of these other transformations in a later lesson, but in this lesson we're going to focus on two of the most common transformations you see on absolute value graphs, and those are the shift up/down and left/right. Any transformation that just moves the graph to a new place, but doesn't actually change the size or shape of it is called a translation.
The shift left/right is accomplished by adding or subtracting to the x within the absolute value. Take the example y=|x-3|. The vertex, or the bottom of the V, is the lowest point of the absolute value, and the way we get the lowest point is have the absolute value be 0, because it can't ever be negative, so the lowest it's going to get is at zero. So before the vertex was at (0,0), but now the only way I can make the absolute value 0 is by substituting in x=3. Then I do 3-3 and I get 0, and so my vertex has now been shifted over to the point (3,0), which means my whole V, my whole graph gets shifted over there, so we end up with the following graph.
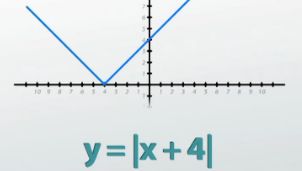 |
Therefore, any number being subtracted on the inside of the absolute value tells us how much shift the graph to the right, which means when you add a number on the inside of the absolute value, you need to shift the graph to the left. For example, y=|x+4| would be over here. This one is easy to make mistakes on because you have to do the opposite of what you'd expect. But I always remind myself by asking 'what do I need to substitute in to make it 0,' and that's always going to be the opposite of the operation going on on the inside.
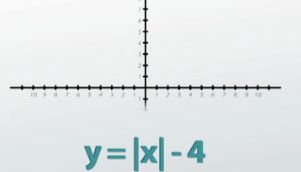
The shift up/down is accomplished by adding or subtracting on the outside of the absolute value. Take the example y=|x|-4. Again the vertex is the lowest point of the graph, and the vertex happens when I take the absolute value of 0, and in this example I'm still going to get the absolute value of 0 just by substituting in 0, but after I do that I still have to subtract 4, so the whole graph gets dragged down 4, and my vertex ends up at (0,-4). This means that subtracting on the outside of the absolute value pulls the whole graph down, which means that adding on the outside of the absolute value pushes the whole graph up. For example, y=|x|+1 would look like this graph here.
This one is normal in the sense that the plus moves it up and the minus moves it down, so it's kind of what you'd expect, whereas the left/right translation is a little bit backwards, so you've got to try to keep those two things organized.
 |
Graphing a Standard Absolute Value Graph
We can combine both of these translations into one problem, and graph things like y=|x+2|+4 by taking our V with vertex at (0,0) and moving it over 2 to the left (because of the +2 on the inside), and up 4 (because of the +4 on the outside) and ending up with an absolute value graph that has a vertex at (-2,4). Because the vertex has coordinates at the values that are being added/subtracted to the equation, the general form of an absolute value equation is y=|x-h|+k where vertex=(h,k). Notice that the h is being subtracted on the inside of the absolute value in the general form, which means that it does the opposite of what you might expect.
To review:
- Absolute value graphs look like the letter V - or the absolute coolest guitar ever, the Gibson Flying V - because where the line would normally turn negative, it the absolute value bounces back up to the positives.
- Transformations change how the graph looks, and the specific transformation that moves the graph to a different place is called a translation.
- The general form equation y=|x-h|+k gives us a graph with a vertex at (h,k) because the number on the inside of the absolute value shifts the graph left/right and the number on the outside shifts it up/down.