Gantt Charts & Bar Graphs: Henry Gantt's Contributions to Management - Quiz
Choose your answer and write the correct one down. Then click HERE for the answers to this quiz.
NOTE: The transcript from the video is listed below the quiz for your reference.
1. Who is responsible for creating the Gantt chart and task and bonus system?
- Fredrick Taylor
- Henry Ford
- Henry Gantt
- Douglas McGregor
- Victor Vroom
2. According to the task and bonus system, an employee should not be paid his regular salary until they are which of these?
- proficient in their job
- a tenured employee
- past their orientation period
- well liked by everyone
- formally trained
3. Which of the following elements are comprised of terminal elements?
- Cumulative elements
- Strategic elements
- Summary elements
- Series elements
- Total elements
4. Which of the following elements include smaller, more intricate tasks that need to be completed as part of a larger task?
- Summary elements
- Strategic elements
- Terminal elements
- Series elements
- Total elements
5. What type of method is the Gantt chart considered to be?
- Visual
- Quantitative
- Administrative
- Scientific
- Contingency
This lesson will describe how Henry Gantt revolutionized management practices by providing a graphical representation, also known as the Gantt chart, of work processes that showed scheduling and monitoring projections. Other contributions of Henry Gantt, such as the task and bonus system, will also be discussed.
Blamestorming
Blamestorming is defined as a group of people sitting around trying to figure out who to blame for missing a project's deadline. Perhaps you've taken part in a blamestorming session. You might even be the reason why your co-workers needed to blamestorm, or maybe you are the blamestorm instigator. No matter what side of the fence you sit on during a blamestorming session, I have a solution for you. It can be found in the works of Henry Gantt! So, all you blamers and blamees, grab a piece of paper and a pen; a solution is about to come your way that will show you how to track project milestones and final deadlines so that you will never have to participate in a blamestorming session again!
 |
Henry Gantt
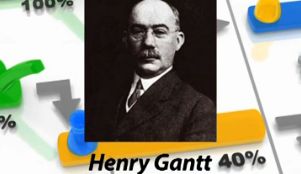
Henry Gantt, an associate of Fredrick Taylor, was a mechanical engineer during the early 1900s who spent his time as an advisor and consultant on management practices. His main focus was to apply scientific analysis to all facets of the work being done as a means of increasing productivity. His two major contributions were the Gantt chart and the task and bonus system, both of which will be discussed next. Much of what Gantt developed during this time was considered groundbreaking, and it revolutionized scientific management. Many of his ideas are still widely used in project management today.
 |
The Gantt Chart
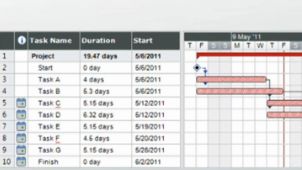
As Gantt spent time scrutinizing the work process with the comprehensive goal of planning and implementing a work breakdown structure, he wanted to have a visual representation of what was actually occurring over the course of a project. Specifically, Gantt focused on creating a graphical representation of work processes that showed scheduling and monitoring projections. What Gantt came up with was a bar chart that demonstrated a project's schedule, showing terminal and summary elements from start to finish.
Terminal elements are the smaller more intricate tasks that need to be completed as part of a larger task. A summary element is made up of terminal elements to form the larger task. For example, a summary element for a car manufacturer would be to paint the vehicle. The terminal elements of painting the vehicle would be to strip any original paint, primer, apply your first, second and top coats, and finally, wash, wax and buff the new paint job. Once the terminal and summary elements are defined, a manager can then add projected and actual projection for completion of each of those elements. The time schedules are plotted on the graph using bars. These can be used to come up with deadlines. Once plotted together, it becomes easy for others to understand the individual work tasks and their due dates within the greater project deadline. This also demonstrates areas that can be done concurrently with other tasks and what tasks are dependent on the completion of others.
 |
The Gantt chart was first used on large construction projects, such as the Hoover Dam in the 1930s and the Eisenhower interstate highway network in the 1950s. Many contemporary managers rely on software programs to create Gantt charts. Such programs have advanced features that allow managers to manipulate data in several ways, aiding in their understanding of the overall project.
Task and Bonus System
Gantt did not find the piecework pay system previously developed by Taylor to be as effective as it needed to be to increase productivity. Gantt's alternative, known as the task and bonus system, paid employees based on how well they improved their performance at the organization. Specifically, the task and bonus system was an incentive program where an employee would receive a bonus above and beyond their set hourly rate once the employee's proficiency hit certain performance goals. This way an employee would always be guaranteed at least his or her hourly rate while working towards higher levels of productivity. This is in contrast to Taylor's piecework pay system, which forced novice employees to have a second job in order to support themselves because Taylor did not believe that an employee should be adequately compensated until they reached a higher level of productivity - almost like an unpaid apprenticeship.
 |
Lesson Summary
To review, Henry Gantt worked alongside Fredrick Taylor for several years and is best known for his development of the Gantt chart. His main focus was on applying scientific analysis to all facets of work being done as a means of increasing productivity. His two major contributions were the Gantt chart and the task and bonus system.
The Gantt chart is still a widely used today in project management and demonstrates a project schedule, showing terminal and summary elements from start to finish and the amount of time it takes to complete each task. Terminal elements are the smaller more intricate tasks that need to be completed as part of a larger task. A summary element is made up of terminal elements to form the larger task. The information that is depicted on the Gantt chart allows others to understand the individual work tasks and their due dates within the greater project deadline.
The task and bonus system was an incentive program aimed at increasing an employee's productivity, whereby an employee would receive a bonus above and beyond their set hourly rate once the employee's proficiency hit certain performance goals. This way an employee would always be guaranteed at least his or her hourly rate while working towards higher levels of productivity.