When you need to summarize quantitative data, words can only go so far. Sometimes, using a chart, graph, or other visual representation can be useful in proving your point. However, it's important to make sure you incorporate this extra information in a way that is easy to understand and in line with the conventions set forth in MLA style.
MLA style specifies three ways of presenting images: tables, figures, and examples. We will focus on tables and figures here, since examples are used only for the presentation of musical scores.
Tables
A table is a chart that presents numerical information in a grid format.
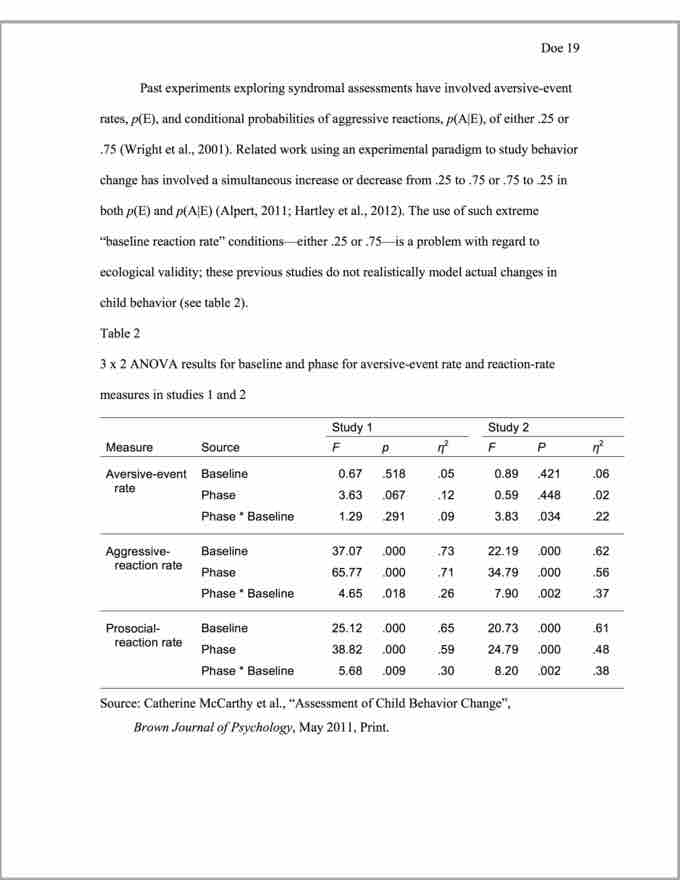
In MLA style, you should present a table immediately after the paragraph in which you mentioned it. When you mention a table in the text of your paper, make sure you refer to it by its number (e.g., "table 4") rather than with a phrase like "the table below" or "this table." For example:
- "The population of frogs in the river has decreased dramatically over the past five years (see table 4)."
The table itself should appear flush with the left margin.
Immediately above the table, write its number in the format "Table 1", followed by a short but descriptive title on the next line; both should be flush with the left margin:
- Frog populations in the Willamette River from 2009-2014
Immediately below the table, write the word "Source" (or or "Sources"), followed by a colon, and then provide the source(s) of the information in the table. Include the citation information, with the same formatting, as in a note in MLA style (i.e., formatted the same as a citation in your Works Cited section, except using commas instead of periods). This source section should end with a period, and it should be formatted with a hanging indent (i.e., the first line should be flush with the left margin, and every subsequent line should be indented 0.5 inches).
- Rottweiler, Florence T., "Amphibians Abound: Wildlife in the Willamette," River Ecology Journal, 54 (1987): 66–146, Print.
Since you have provided the full citation information here, you do not need to also cite this source in the Works Cited section at the end of your paper.

MLA table
This table and its title and source are formatted correctly according to the MLA handbook.
Figures
A figure, by the MLA's definition, is anything that is not a table or an example. This is therefore the broadest category; it includes images, graphs, and anything else aside from a table or musical score.
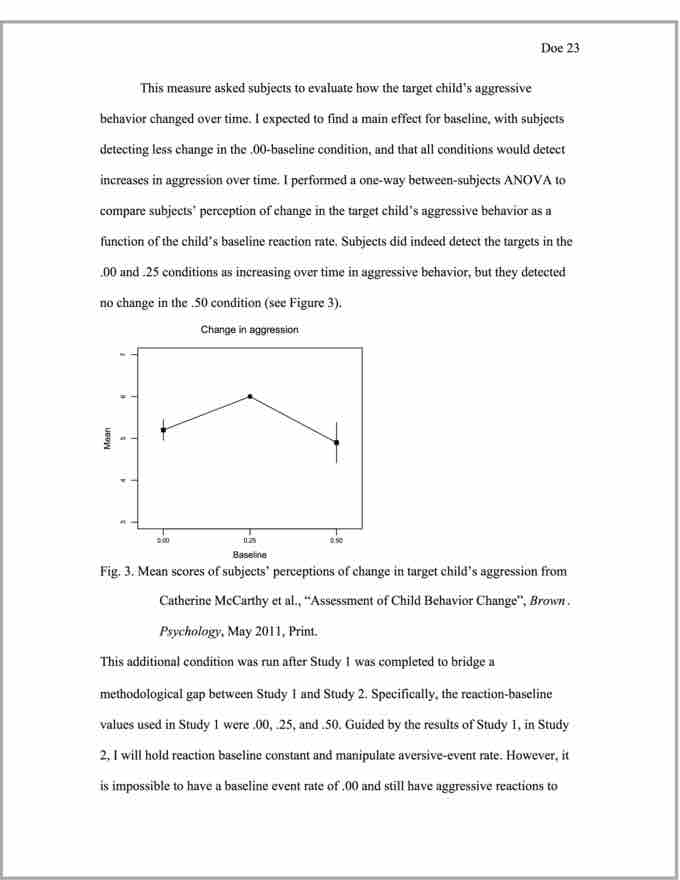
Treat a figure much as you would treat a table, with two exceptions: (1) you may center it horizontally if you choose, and (2) all information about the figure, including its number ("Figure 1"; you may abbreviate to "Fig. 1" if you choose) and title ("Frogs in the Willamette River, 2012") should appear on the line immediately below the figure.
The source information should appear on the next line after the figure title begin on the same line as the figure title after the word "from." As with a table, present the source information formatted as a note and with a hanging indent, and do not cite it again in your Works Cited section.

MLA figure
This figure and its title and source are formatted correctly according to the MLA handbook.