Concept
Version 10
Created by Boundless
Drawing a Histogram

Histogram Example
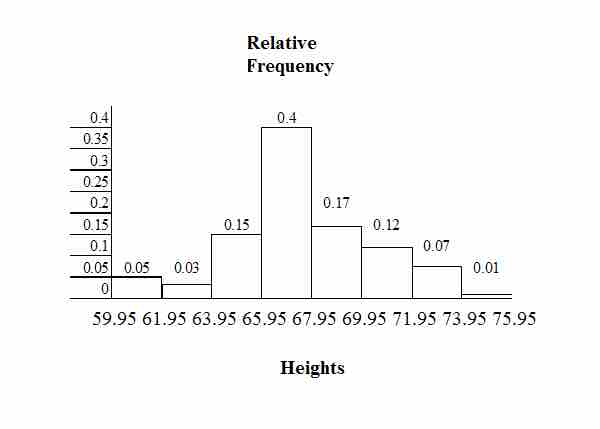
This histogram depicts the relative frequency of heights for 100 semiprofessional soccer players. Note the roughly normal distribution, with the center of the curve around 66 inches.
Source
Boundless vets and curates high-quality, openly licensed content from around the Internet. This particular resource used the following sources:
"Susan DeanBarbara Illowsky, Ph.D., Descriptive Statistics: Histogram. Mar 28, 2013."
http://cnx.org/contents/20a79748-b312-4c07-ab87-820c5d8aec6e@14
OpenStax CNX
CC BY 4.0.