Women have traditionally had limited access to higher education. Moreover, when women began to be admitted to higher education, they were encouraged to major in less-intellectual subjects. For example, the study of English literature in American and British colleges and universities was instituted as a field considered suitable to women's "lesser intellects".
However, since 1991 the proportion of women enrolled in college in the U.S. has exceeded the enrollment rate for men, and that gap has widened over time. As of 2007, women made up the majority — 54 percent — of the 10.8 million college students enrolled in the U.S.
This has not negated the fact that gender bias exists in higher education. Women tend to score lower on graduate admissions exams, such as the Graduate Record Exam (GRE) and the Graduate Management Admissions Test (GMAT). Representatives of the companies that publish these tests have hypothesized that greater number of female applicants taking these tests pull down women's average scores. However, statistical research proves this theory wrong. Controlling for the number of people taking the test does not account for the scoring gap.
Sex Bias at the University of California, Berkeley
On February 7, 1975, a study was published in the journal Science by P.J. Bickel, E.A. Hammel, and J.W. O'Connell entitled "Sex Bias in Graduate Admissions: Data from Berkeley. " This study was conducted in the aftermath of a law suit filed against the University, citing admission figures for the fall of 1973, which showed that men applying were more likely than women to be admitted, and the difference was so large that it was unlikely to be due to chance.
Examination of the aggregate data on admissions showed a blatant, if easily misunderstood, pattern of gender discrimination against applicants.
Aggregate Data:
Men: 8,442 applicants - 44% admitted
Women: 4,321 applicants - 35% admitted
When examining the individual departments, it appeared that no department was significantly biased against women. In fact, most departments had a small but statistically significant bias in favor of women. The data from the six largest departments are listed below.
Department A
Men: 825 applicants - 62% admitted
Women: 108 applicants - 82% admitted
Department B
Men: 560 applicants - 63% admitted
Women: 25 applicants - 68% admitted
Department C
Men: 325 applicants - 37% admitted
Women: 593 applicants - 34% admitted
Department D
Men: 417 applicants - 33% admitted
Women: 375 applicants - 35% admitted
Department E
Men: 191 applicants - 28% admitted
Women: 393 applicants - 24% admitted
Department F
Men: 272 applicants - 6% admitted
Women: 341 applicants - 7% admitted
The research paper by Bickel et al. concluded that women tended to apply to competitive departments with low rates of admission even among qualified applicants (such as in the English Department), whereas men tended to apply to less-competitive departments with high rates of admission among the qualified applicants (such as in engineering and chemistry). The study also concluded that the graduate departments that were easier to enter at the University, at the time, tended to be those that required more undergraduate preparation in mathematics. Therefore, the admission bias seemed to stem from courses previously taken.
Confounding Variables and Simpson's Paradox
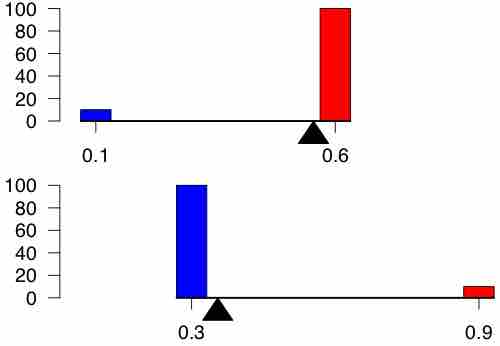
The above study is one of the best known real life examples of an experiment suffering from a confounding variable. In this particular case, we can see an occurrence of Simpson's Paradox . Simpson's Paradox is a paradox in which a trend that appears in different groups of data disappears when these groups are combined, and the reverse trend appears for the aggregate data. This result is often encountered in social-science and medical-science statistics, and is particularly confounding when frequency data are unduly given causal interpretations.

Simpson's Paradox
An illustration of Simpson's Paradox. For a full explanation of the figure, visit: http://en.wikipedia.org/wiki/Simpson's_paradox#Description
The practical significance of Simpson's paradox surfaces in decision making situations where it poses the following dilemma: Which data should we consult in choosing an action, the aggregated or the partitioned? The answer seems to be that one should sometimes follow the partitioned and sometimes the aggregated data, depending on the story behind the data; with each story dictating its own choice.
As to why and how a story, not data, should dictate choices, the answer is that it is the story which encodes the causal relationships among the variables. Once we extract these relationships we can test algorithmically whether a given partition, representing confounding variables, gives the correct answer.

Confounding Variables in Practice
One of the best real life examples of the presence of confounding variables occurred in a study regarding sex bias in graduate admissions here, at the University of California, Berkeley.