Procedure for the Goodness of Fit Test
Goodness of fit means how well a statistical model fits a set of observations. A measure of goodness of fit typically summarize the discrepancy between observed values and the values expected under the model in question. Such measures can be used in statistical hypothesis testing, e.g., to test for normality of residuals or to test whether two samples are drawn from identical distributions.
In this type of hypothesis test, we determine whether the data "fit" a particular distribution or not. For example, we may suspect that our unknown data fits a binomial distribution. We use a chi-square test (meaning the distribution for the hypothesis test is chi-square) to determine if there is a fit or not. The null and the alternate hypotheses for this test may be written in sentences or may be stated as equations or inequalities.
The test statistic for a goodness-of-fit test is:
where
The observed values are the data values and the expected values are the values we would expect to get if the null hypothesis was true. The degrees of freedom are found as follows:
where
As an example, suppose a coin is tossed 100 times. The outcomes would be expected to be 50 heads and 50 tails. If 47 heads and 53 tails are observed instead, does this deviation occur because the coin is biased, or is it by chance?
The null hypothesis for the above experiment is that the observed values are close to the predicted values. The alternative hypothesis is that they are not close to the predicted values. These hypotheses hold for all chi-square goodness of fit tests. Thus in this case the null and alternative hypotheses corresponds to:
Null hypothesis: The coin is fair.
Alternative hypothesis: The coin is biased.
We calculate chi-square by substituting values for
For heads:
For tails:
The sum of these categories is:
Significance of the chi-square test for goodness of fit value is established by calculating the degree of freedom

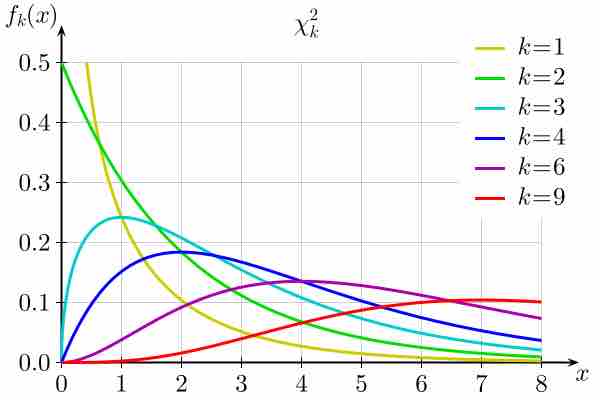
Chi-Square Distribution
Plot of the chi-square distribution for values of