Since the variance is a squared quantity, it cannot be directly compared to the data values or the mean value of a data set. It is therefore more useful to have a quantity that is the square root of the variance. The standard error is an estimate of how close to the population mean your sample mean is likely to be, whereas the standard deviation is the degree to which individuals within the sample differ from the sample mean. This quantity is known as the standard deviation.
Standard deviation (represented by the symbol sigma,
In statistics, the standard deviation is the most common measure of statistical dispersion. However, in addition to expressing the variability of a population, standard deviation is commonly used to measure confidence in statistical conclusions. For example, the margin of error in polling data is determined by calculating the expected standard deviation in the results if the same poll were to be conducted multiple times.
Basic Calculation
Consider a population consisting of the following eight values:
2, 4, 4, 4, 5, 5, 7, 9
These eight data points have a mean (average) of 5:
To calculate the population standard deviation, first compute the difference of each data point from the mean, and square the result of each:
Next, compute the average of these values, and take the square root:
This quantity is the population standard deviation, and is equal to the square root of the variance. The formula is valid only if the eight values we began with form the complete population. If the values instead were a random sample drawn from some larger parent population, then we would have divided by 7 (which is
Estimation
The sample standard deviation,
As mentioned above, most often the standard deviation is estimated using the corrected sample standard deviation (using
- Using the uncorrected estimator (using
$N$ ) yields lower mean squared error. - Using
$N-1.5$ (for the normal distribution) almost completely eliminates bias.
Relationship with the Mean
The mean and the standard deviation of a set of data are usually reported together. In a certain sense, the standard deviation is a "natural" measure of statistical dispersion if the center of the data is measured about the mean. This is because the standard deviation from the mean is smaller than from any other point. Variability can also be measured by the coefficient of variation, which is the ratio of the standard deviation to the mean.
Often, we want some information about the precision of the mean we obtained. We can obtain this by determining the standard deviation of the sampled mean, which is the standard deviation divided by the square root of the total amount of numbers in a data set:

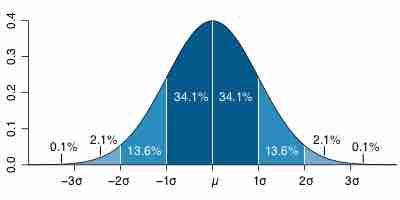
Standard Deviation Diagram
Dark blue is one standard deviation on either side of the mean. For the normal distribution, this accounts for 68.27 percent of the set; while two standard deviations from the mean (medium and dark blue) account for 95.45 percent; three standard deviations (light, medium, and dark blue) account for 99.73 percent; and four standard deviations account for 99.994 percent.