Descriptive statistics can be manipulated in many ways that can be misleading. Graphs need to be carefully analyzed, and questions must always be asked about "the story behind the figures. " Potential manipulations include:
- changing the scale to change the appearence of a graph
- omissions and biased selection of data
- focus on particular research questions
- selection of groups
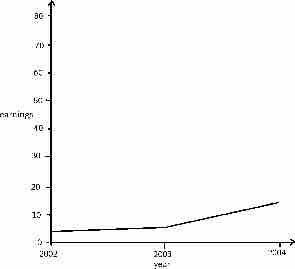
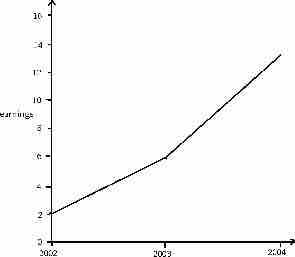
As an example of changing the scale of a graph, consider the following two figures, and .

Effects of Changing Scale
In this graph, the earnings scale is greater.

Effects of Changing Scale
This is a graph plotting yearly earnings.
Both graphs plot the years 2002, 2003, and 2004 along the x-axis. However, the y-axis of the first graph presents earnings from "0 to 10," while the y-axis of the second graph presents earnings from "0 to 30. " Therefore, there is a distortion between the two of the rate of increased earnings.
Statistical Bias
Bias is another common distortion in the field of descriptive statistics. A statistic is biased if it is calculated in such a way that is systematically different from the population parameter of interest. The following are examples of statistical bias.
- Selection bias occurs when individuals or groups are more likely to take part in a research project than others, resulting in biased samples.
- Spectrum bias arises from evaluating diagnostic tests on biased patient samples, leading to an overestimate of the sensitivity and specificity of the test.
- The bias of an estimator is the difference between an estimator's expectations and the true value of the parameter being estimated.
- Omitted-variable bias appears in estimates of parameters in a regression analysis when the assumed specification is incorrect, in that it omits an independent variable that should be in the model.
- In statistical hypothesis testing, a test is said to be unbiased when the probability of rejecting the null hypothesis is less than or equal to the significance level when the null hypothesis is true, and the probability of rejecting the null hypothesis is greater than or equal to the significance level when the alternative hypothesis is true.
- Detection bias occurs when a phenomenon is more likely to be observed and/or reported for a particular set of study subjects.
- Funding bias may lead to selection of outcomes, test samples, or test procedures that favor a study's financial sponsor.
- Reporting bias involves a skew in the availability of data, such that observations of a certain kind may be more likely to be reported and consequently used in research.
- Data-snooping bias comes from the misuse of data mining techniques.
- Analytical bias arises due to the way that the results are evaluated.
- Exclusion bias arises due to the systematic exclusion of certain individuals from the study
Limitations of Descriptive Statistics
Descriptive statistics is a powerful form of research because it collects and summarizes vast amounts of data and information in a manageable and organized manner. Moreover, it establishes the standard deviation and can lay the groundwork for more complex statistical analysis.
However, what descriptive statistics lacks is the ability to:
- identify the cause behind the phenomenon because it only describes and reports observations;
- correlate (associate) data or create any type of statistical relationship modeling relationship among variables;
- account for randomness; and
- provide statistical calculations that can lead to hypothesis or theories of populations studied.
To illustrate you can use descriptive statistics to calculate a raw GPA score, but a raw GPA does not reflect:
- how difficult the courses were, or
- the identity of major fields and disciplines in which courses were taken.
In other words, every time you try to describe a large set of observations with a single descriptive statistics indicator, you run the risk of distorting the original data or losing important detail.