Concept
Version 5
Created by Boundless
Measures of Relative Standing

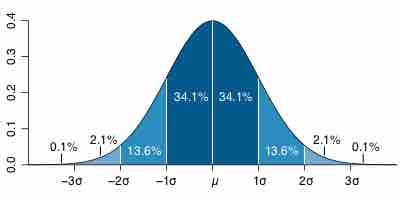
Percentile Diagram
Representation of the 68–95–99.7 rule. The dark blue zone represents observations within one standard deviation (
Source
Boundless vets and curates high-quality, openly licensed content from around the Internet. This particular resource used the following sources:
"Standard deviation diagram."
http://en.wikipedia.org/wiki/File:Standard_deviation_diagram.svg
Wikipedia
CC BY.