The comparison of two sample means is very common. The difference between the two samples depends on both the means and the standard deviations. Very different means can occur by chance if there is great variation among the individual samples. In order to account for the variation, we take the difference of the sample means,
and divide by the standard error in order to standardize the difference. The result is a t-score test statistic.
t-Test for Two Means
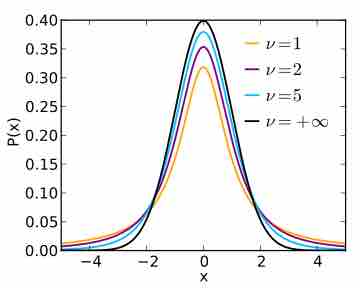
Although the t-test will be explained in great detail later in this textbook, it is important for the reader to have a basic understanding of its function in regard to comparing two sample means. A t-test is any statistical hypothesis test in which the test statistic follows Student's t distribution, as shown in , if the null hypothesis is supported. It can be used to determine if two sets of data are significantly different from each other.

Student t Distribution
This is a plot of the Student t Distribution for various degrees of freedom.
In the t-test comparing the means of two independent samples, the following assumptions should be met:
- Each of the two populations being compared should follow a normal distribution.
- If using Student's original definition of the t-test, the two populations being compared should have the same variance. If the sample sizes in the two groups being compared are equal, Student's original t-test is highly robust to the presence of unequal variances.
- The data used to carry out the test should be sampled independently from the populations being compared. This is, in general, not testable from the data, but if the data are known to be dependently sampled (i.e., if they were sampled in clusters), then the classical t-tests discussed here may give misleading results.
Two-sample t-tests for a difference in mean involve independent samples, paired samples and overlapping samples. The independent samples t-test is used when two separate sets of independent and identically distributed samples are obtained, one from each of the two populations being compared. For example, suppose we are evaluating the effects of a medical treatment. We enroll 100 subjects into our study, then randomize 50 subjects to the treatment group and 50 subjects to the control group. In this case, we have two independent samples and would use the unpaired form of the t-test.
Paired sample t-tests typically consist of a sample of matched pairs of similar units or one group of units that has been tested twice (a "repeated measures" t-test). A typical example of the repeated measures t-test would be where subjects are tested prior to a treatment (say, for high blood pressure) and the same subjects are tested again after treatment with a blood-pressure lowering medication. By comparing the same patient's numbers before and after treatment, we are effectively using each patient as their own control.
An overlapping sample t-test is used when there are paired samples with data missing in one or the other samples. These tests are widely used in commercial survey research (e.g., by polling companies) and are available in many standard crosstab software packages.