In statistics, regression toward (or to) the mean is the phenomenon that if a variable is extreme on its first measurement, it will tend to be closer to the average on its second measurement—and, paradoxically, if it is extreme on its second measurement, it will tend to be closer to the average on its first. To avoid making wrong inferences, regression toward the mean must be considered when designing scientific experiments and interpreting data.
The conditions under which regression toward the mean occurs depend on the way the term is mathematically defined. Sir Francis Galton first observed the phenomenon in the context of simple linear regression of data points. However, a less restrictive approach is possible. Regression towards the mean can be defined for any bivariate distribution with identical marginal distributions. Two such definitions exist. One definition accords closely with the common usage of the term "regression towards the mean". Not all such bivariate distributions show regression towards the mean under this definition. However, all such bivariate distributions show regression towards the mean under the other definition.
Historically, what is now called regression toward the mean has also been called reversion to the mean and reversion to mediocrity.
Consider a simple example: a class of students takes a 100-item true/false test on a subject. Suppose that all students choose randomly on all questions. Then, each student's score would be a realization of one of a set of independent and identically distributed random variables, with a mean of 50. Naturally, some students will score substantially above 50 and some substantially below 50 just by chance. If one takes only the top scoring 10% of the students and gives them a second test on which they again choose randomly on all items, the mean score would again be expected to be close to 50. Thus the mean of these students would "regress" all the way back to the mean of all students who took the original test. No matter what a student scores on the original test, the best prediction of his score on the second test is 50.
If there were no luck or random guessing involved in the answers supplied by students to the test questions, then all students would score the same on the second test as they scored on the original test, and there would be no regression toward the mean.
Most realistic situations fall between these two extremes: for example, one might consider exam scores as a combination of skill and luck. In this case, the subset of students scoring above average would be composed of those who were skilled and had not especially bad luck, together with those who were unskilled, but were extremely lucky. On a retest of this subset, the unskilled will be unlikely to repeat their lucky break, while the skilled will have a second chance to have bad luck. Hence, those who did well previously are unlikely to do quite as well in the second test.
The following is a second example of regression toward the mean. A class of students takes two editions of the same test on two successive days. It has frequently been observed that the worst performers on the first day will tend to improve their scores on the second day, and the best performers on the first day will tend to do worse on the second day. The phenomenon occurs because student scores are determined in part by underlying ability and in part by chance. For the first test, some will be lucky, and score more than their ability, and some will be unlucky and score less than their ability. Some of the lucky students on the first test will be lucky again on the second test, but more of them will have (for them) average or below average scores. Therefore a student who was lucky on the first test is more likely to have a worse score on the second test than a better score. Similarly, students who score less than the mean on the first test will tend to see their scores increase on the second test.
Regression toward the mean is a significant consideration in the design of experiments.
The concept of regression toward the mean can be misused very easily.In the student test example above, it was assumed implicitly that what was being measured did not change between the two measurements. Suppose, however, that the course was pass/fail and students were required to score above 70 on both tests to pass. Then the students who scored under 70 the first time would have no incentive to do well, and might score worse on average the second time. The students just over 70, on the other hand, would have a strong incentive to study and concentrate while taking the test. In that case one might see movement away from 70, scores below it getting lower and scores above it getting higher. It is possible for changes between the measurement times to augment, offset or reverse the statistical tendency to regress toward the mean.
Statistical regression toward the mean is not a causal phenomenon. A student with the worst score on the test on the first day will not necessarily increase her score substantially on the second day due to the effect. On average, the worst scorers improve, but that is only true because the worst scorers are more likely to have been unlucky than lucky. To the extent that a score is determined randomly, or that a score has random variation or error, as opposed to being determined by the student's academic ability or being a "true value", the phenomenon will have an effect.

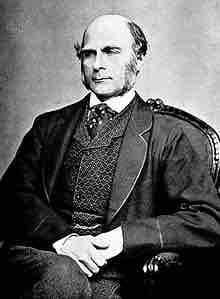
Sir Francis Galton
Sir Frances Galton first observed the phenomenon of regression towards the mean in genetics research.