Concept
Version 10
Created by Boundless
Outliers

Statistical outliers
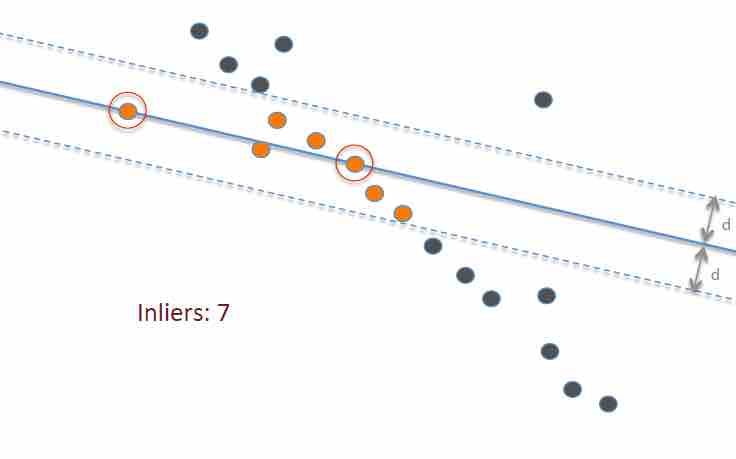
This graph shows a best-fit line (solid blue) to fit the data points, as well as two extra lines (dotted blue) that are two standard deviations above and below the best fit line. Highlighted in orange are all the points, sometimes called "inliers", that lie within this range; anything outside those lines—the dark-blue points—can be considered an outlier.
Source
Boundless vets and curates high-quality, openly licensed content from around the Internet. This particular resource used the following sources:
"RANSAC_Inliers_and_Outliers.png."
https://commons.wikimedia.org/wiki/File:RANSAC_Inliers_and_Outliers.png
Wikimedia
CC BY-SA 4.0.