Profit and Pricing Objectives
Some firms decide to set prices to maximize profits for either the short run or the long run. There are several methods to maximizing profits:
Profit-based Sales Targets
In launching new products or considering the pricing of current products, managers often start with an idea of the dollar profit they desire and ask what level of sales will be needed to reach it. Target volume (#) is the unit sales quantity needed to meet an earnings goal. Target revenue ($) is the corresponding figure for dollar sales. Increasingly, marketers are expected to generate volumes that meet the target profits of their firm. This will often require them to revise sales targets as prices and costs change.
The purpose of profit-based sales target metrics is to ensure that marketing and sales objectives mesh with profit targets. In target volume and target revenue calculations, managers go beyond break-even analysis (the point at which a company sells enough to cover its fixed costs) to determine the level of unit sales or revenues needed to cover a firm's costs and attain its profit targets.
The Total Cost Method
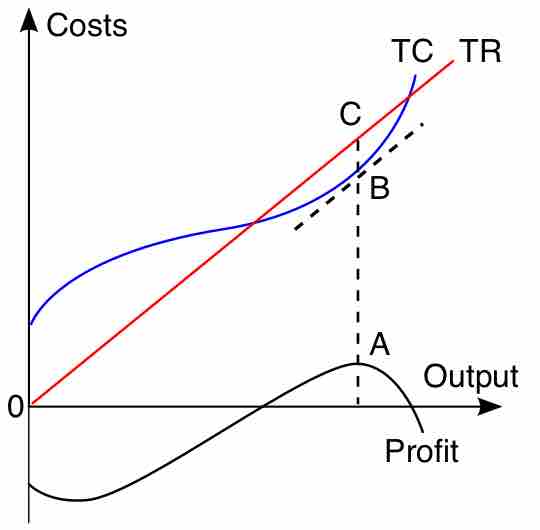
To obtain the profit maximizing output quantity, you start by recognizing that profit is equal to total revenue (TR) minus total cost (TC). Given a table of costs and revenues at each quantity, we can either compute equations or plot the data directly on a graph. The profit maximizing output is the one at which this difference reaches its maximum. In , the linear total revenue curve represents the case in which the firm is a perfect competitor in the goods market, and thus cannot set its own selling price. The profit maximizing output level is represented as the one at which total revenue is the height of C and total cost is the height of B; the maximal profit is measured as CB. This output level is also the one at which the total profit curve is at its maximum. If, contrary to what is assumed in the graph, the firm is not a perfect competitor in the output market, the price to sell the product at can be read off the demand curve at the firm's optimal quantity of output.

Total Profit Maximization
This linear total revenue curve represents the case in which the firm is a perfect competitor in the goods market, and thus cannot set its own selling price.
The Marginal Cost Perspective
An alternative perspective relies on the relationship that, for each unit sold, marginal profit (Mπ) equals marginal revenue (MR) minus marginal cost (MC). Then, if marginal revenue is greater than marginal cost at some level of output, marginal profit is positive and thus a greater quantity should be produced, and if marginal revenue is less than marginal cost, marginal profit is negative and a lesser quantity should be produced. At the output level at which marginal revenue equals marginal cost, marginal profit is zero and this quantity is the one that maximizes profit. Since total profit increases when marginal profit is positive and total profit decreases when marginal profit is negative, it must reach a maximum where marginal profit is zero - or where marginal cost equals marginal revenue - and where lower or higher output levels give lower profit levels.