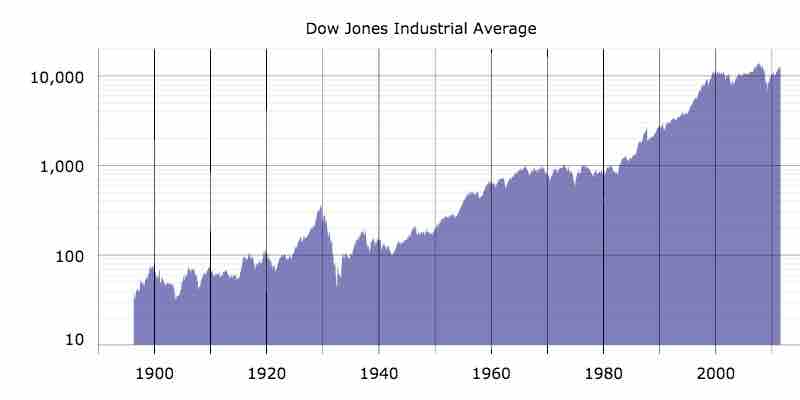
Historical Graph of the Dow Jones Industrial Average
This graph shows the general increase in the DJIA over the last century. Particularly notable is the growth from around 1,000 points in the late 1980s to around 10,000 points in 2005.
Source
Boundless vets and curates high-quality, openly licensed content from around the Internet. This particular resource used the following sources:
"DJIA_historical_graph_to_jul11_28log29.svg."
https://commons.wikimedia.org/wiki/File:DJIA_historical_graph_to_jul11_(log).svg
Wikimedia Commons
CC BY-SA 3.0.
.svg)