Break-Even Analysis and Operating Leverage
Recall that operating leverage describes the relationship between fixed and variable costs. Having high operating leverage (having a larger proportion of fixed costs compared to variable costs) can lead to much higher profits for a company. However, increasing operating leverage can also cause substantial losses and puts more pressure on a business. The key to understanding the appropriate amount of operating leverage lies in analysis of the break-even point.
Break-Even Definition
Break-even analysis tells a company how much it needs to sell in order to pay for an investment-- or at what point expenses and revenue are equal.
To find the amount of units required to be sold in order to break even, we simply divide the total fixed costs by the unit contribution margin.

Unit Contribution Margin
Contribution margin (C) is the unit net revenue (P = price) minus unit variable cost (V = variable cost).
Unit contribution margin can be thought of as the fraction of sales, or amount of each unit sold, that contributes to the offset of fixed costs. It is simply the unit net revenue minus the unit variable cost. When sales have exceeded the break-even point, a larger contribution margin will mean greater increases in profits for a company. By inserting different prices into the break-even formula, you will obtain a number of break-even points-- one for each possible price charged.

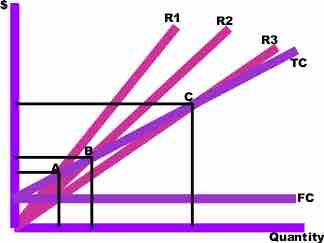
Multiple Break-Even Prices
R1, R2 and R3 = revenues at different chosen prices. TC = total cost curve. FC = fixed cost curve.
In the above graph, points A, B, and C are the break-even points. The break-even quantity at each selling price can be read off the horizontal axis and the break-even price can be read off the vertical axis.
Break-Even Application
Break-even analysis helps to provide a dynamic view of the relationships between sales, costs and profits. By providing a better understanding of the amount of success an investment or project must attain, break-even analysis gives companies a benchmark to compare to and an idea about what level of operating leverage will be ideal to generate greater profits.

Breakeven Example
FC = 1,000. P = 20. VC = 5.