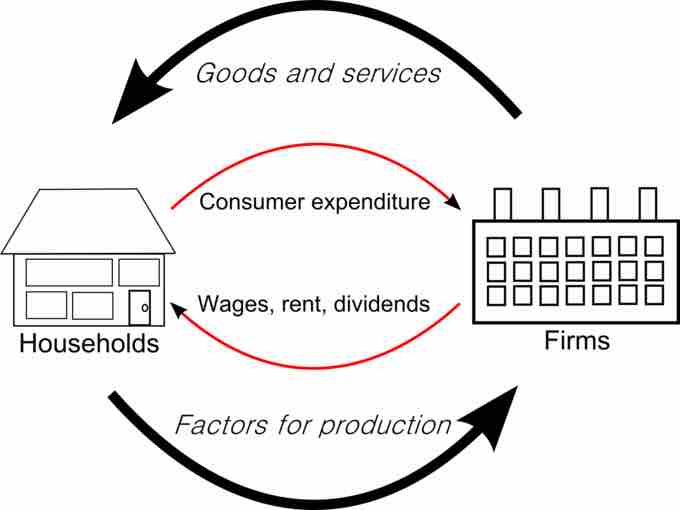
In economics, a circular flow model is a diagram that is used to represent the monetary transactions in an economy. There are two flows present within the model including flows of physical things (goods or labor) and flows of money (what pays for physical things). A circular flow model depicts the inner workings of a market system and specific portions of the economy.
The basic circular flow model consists of two sectors that determine income, expenditure, and output. A state of equilibrium is reached when there is no tendency for the levels of income (

Circular flow of goods income
The circular flow model shows the flow of payments between households and firms.
The circular flow of payments is important within an economy because it 1) measures the national income, 2) provides knowledge of interdependence, 3) illustrates the unending nature of economic activities, and 4) shows injections and leakages.
The circular flow of income follows a specific pattern: Production → Income → Expenditure → Production. This circular flow is ongoing between households and firms.
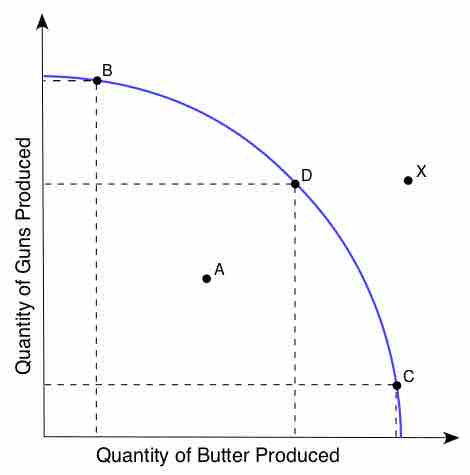
The circular flow of income can also be analyzed using the production possibility frontier (PPF). The PPF is a graph that shows the various combinations of amounts of two commodities that could be produced using the same fixed total amount of each of the factors of production. The graph shows the maximum possible production level of one commodity for any production level of the other, based on the state of technology. The PPF defines production efficiency. A point of the frontier line indicates the efficient use of available inputs, while a point beneath the curve shows inefficiency. A PPF graphs shows opportunity cost, actual output, potential output, and economic growth.

Production Possibilities Frontier Curve
The graph illustrates a typical production possibilities frontier curve. When a market is operating on the PPF it is said to be efficient.