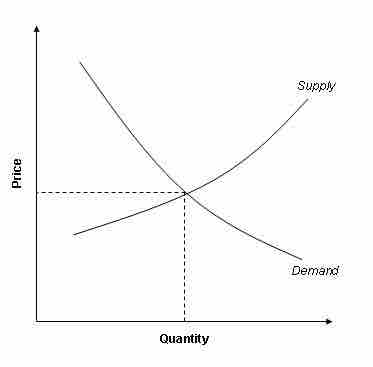
A demand curve is the graphical depiction of the relationship between the price of a certain commodity and the amount of it that consumers are willing and able to purchase at that price. Demand curves are used to estimate behaviors in competitive markets and are often used with supply curves to estimate the market equilibrium price, or the price at which sellers are willing to sell the same amount of a product as the market's buyers are willing purchase. A demand graph can reflect the preferences of a single consumer, a group of consumers or an entire market . For demand graphs that reflect a group, the individual demands at each price are added together.
Demand is the willingness and ability of a consumer to purchase a good under the prevailing circumstances. It is defined by three elements:
- Individual Utility: An item's utility is based on its ability to satisfy an individual's needs or wants. Some utility is universal; every human needs water to survive so it has high utility for everyone. Some utility is based on personal preference; some people prefer Coke over Pepsi so for them Coke has the higher utility. The more people that find utility in the good the greater the market demand; the greater the individual utility in the product the greater the individual demand.
- Purchasing Power: Demand is measured based on a person's willingness to buy under the prevailing circumstances. If an individual lacks the money to purchase the product, she can't demand it because she cannot afford it.
- Ability to Decide: The individual must be able to choose to make a purchase. Sometimes circumstances may prevent a person from purchasing something they might desire, even if they have the necessary money. For example, an underaged person may not be permitted by law to purchase cigarettes. That person might want the cigarettes and can afford to purchase them, but since it is against the law for him to purchase it, there is no demand.
For the vast majority of goods and services, an increase in price will lead to a decrease in the quantity demanded . There are two exceptions to this general rule.

Supply and demand graph
The downward sloping demand curve reflects the fact that as price increases, consumers willing to purchase less of the good or service.
Veblen Goods
Veblen goods are expensive luxury products, such as designer handbags and high-end cars. In these rare circumstances, decreasing the price actually decreases the demand for the good. The reason for this is because part of the value of the good is exclusivity. These items are status symbols and lowering the price diminishes the status.
Giffen Goods
Giffen goods are another example where rising prices can lead to increased demand for a product. Giffen goods are very rare and are defined by three characteristics:
- It is an inferior good, or a good for which demand decreases as consumer income rises,
- There must be a lack of substitute product,
- The good must constitute a substantial percentage of the buyer's income, but not such a substantial percentage of the buyer's income that none of the associated normal goods are consumed.
For example, imagine a significant portion of a family's grocery bill is bread. Bread is a staple and it is the cheapest option out of the food available. If bread prices rise, the family will need to cut back on other groceries to make up the difference. However, since the family still need to eat a certain amount of calories each day and bread is still the cheapest option, they will purchase more bread to make up for the food they aren't purchasing and consuming. In this instance, bread is a giffen good.