Economics assumes a population of rational consumers, subjected to the complexities of modern economics while they attempt to maximize the utility obtainable within their income range. Central principles to analyzing consumer actions and choices are income effect and the substitution effect, which ultimately generate a labor supply to illustrate the labor-leisure trade-off for consumers.
Income Effect
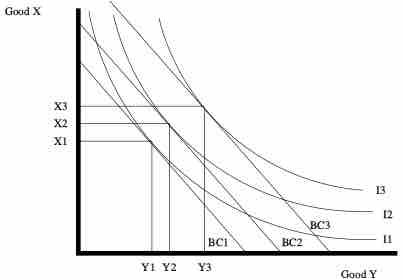
The income effect needs two simple inputs: the average price of goods and the consumer's income level. This creates a relative buying power, which will play a substantial role in the quantity of goods purchased. Predicting consumer choice requires inputs on consumer purchasing power and the goods in which they are deciding between. In we are comparing 'Good X' and 'Good Y' to identify how a change in income will alter the overall amount of each good would likely be purchased along a series of indifference curves (see Boundless atom on 'Indifference Curves'). This graphical representation of a consumer's income (I) and budget constraints (BC) underlines the variance in quantity of 'Good X' and 'Good Y' that will be demanded dependent upon income circumstance. Naturally, a higher income will result in a shift towards increase in quantity for many consumable goods/services.

Income Effects on Consumption and Budget Constraints
This graphical representation of a consumers income(I) and budget constraints (BC) underlines the variance in quantity of 'Good X' and 'Good Y' that will be demanded dependent upon income circumstance. Naturally, a higher income will result in a shift towards increase in quantity for many consumable goods/services.
Substitution Effect
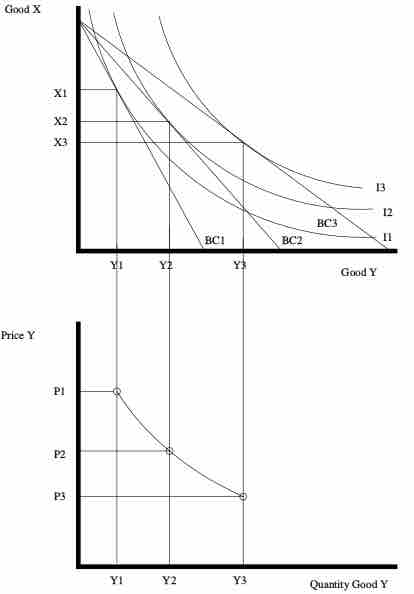
The substitution effect is closely related to that of the income effect, where the price of goods and a consumers income will play a role in the decision-making process. In the substitution effect, a lower purchasing power will generally result in a shift towards more affordable goods (substituting cheaper in place of more expensive goods) while a higher purchasing power often results in substituting more expensive goods for cheaper ones. This shows the relationship between two graphs, pointing out how the substitution effect identifies the relationship between the price of a given good and the quantity purchased by a given consumer. As the bottom half of the figure implies, a higher price will dictate a lower quantity consumer for 'Good Y', while a lower price will create a higher quantity. This translates to the graph above as the consumer makes choices to maximize utility when comparing the price of different goods to a given income level, substituting cheaper goods and more expensive goods dependent upon purchasing power.

Substitution Effect
This two-part graphical representation of the substitution effect identifies the relationship between the price of a given good and the quantity purchased by a given consumer. As the bottom half effectively highlights, a higher price will dictate a lower quantity consumer for 'Good Y', while a lower price will create a higher quantity. This translates to the graph above as the consumer makes choices to maximize utility when comparing the price of different goods to a given income level.
Types of Goods
One additional important component of consumer choice is the way in which different goods demonstrate different reactions to income alterations and price changes:
- Income Changes: When income changes rises or falls, consumption of certain types of goods will have a positive or negative correlation with these changes. With normal goods, an increase of income will correlate with a higher quantity of consumption while a decrease in income will see a decrease in consumption. Inferior goods, on the other hand, will demonstrate an inverse relationship. A rise in income will cause a decrease in their consumption and vice versa.
- Price Changes: When price rises or falls, consumption of certain types of good will either demonstrate positive or negative correlations to these shifts in regard to quantity consumed. Ordinary goods will demonstrate the intuitive situation, where a rise in price will result in a decrease in quantity consumer. Inversely, Giffen goods demonstrate a positive relationship, where the price rises will result in higher demand for the good and high consumption.
Labor Supply Curve
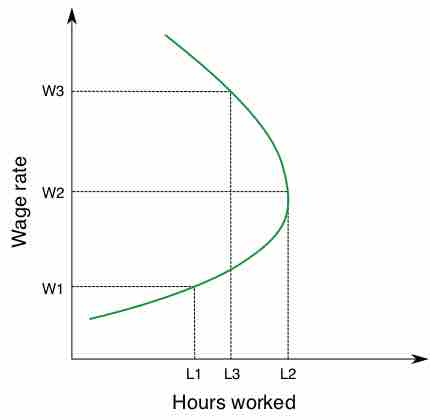
These concepts of income versus required monetary inputs (prices) for goods/services generates a relationship between how much an individual will choose to work and how much an individual can take in terms of leisure time. Simply put, desired labor and leisure time are dependent upon income and prices for goods. The relationship between the number of hours worked and the overall wage levels results in something of a boomerang effect, with hours worked as the x-axis and wages as the y-axis.
Graphically represented, the labor supply curve looks like a backwards-bending curve , where an increase in wages from W1 to W2 will result in more hours being worked and an increase from W2 to W3 will result in less. This is primarily due to the fact that there is a certain amount of capital attained by consumers where they will be satisfied with their monetary utility, at which point working more has diminishing returns on their satisfaction. A rational consumer will begin to work less hours after meeting their consumption requirements in order to capture the value of leisure (and enjoy their income in a meaningful way).

Labor Supply Curve
The concept of labor supply economics is most efficiently communicated via the following graphical representation. This graph demonstrates the relationship between hours work and overall wage rates, demonstrating the shift in utility as wages increase.
To apply this to the concept of different types of goods above, one can view wage rates and leisure time as consumer goods. Depending on which point on the backwards-bending curve we are on, the trade-offs and thus the consumer decision will change. If a worker choose to work more when the wage rate rises, leisure is an ordinary good.