Phase diagrams illustrate the effects selected variables of a system have on the state of matter. Phase diagrams are divided into three single phase regions that cover the pressure-temperature space over which the matter being evaluated exists: liquid, gaseous, and solid states. The lines that separate these single phase regions are known as phase boundaries. Along the phase boundaries, the matter being evaluated exists simultaneously in equilibrium between the two states that border the phase boundary.
By focusing attention on distinct single phase regions, phase diagrams help us to understand the range over which a particular pure sample of matter exists as a particular phase. By examining the phase boundaries and the triple point, researchers can use phase diagrams to understand under which conditions a pure sample of matter exists in two or three state equilibrium. Phase diagrams can also be used to explain the behavior of a pure sample of matter at the critical point.

A Typical Phase Diagram
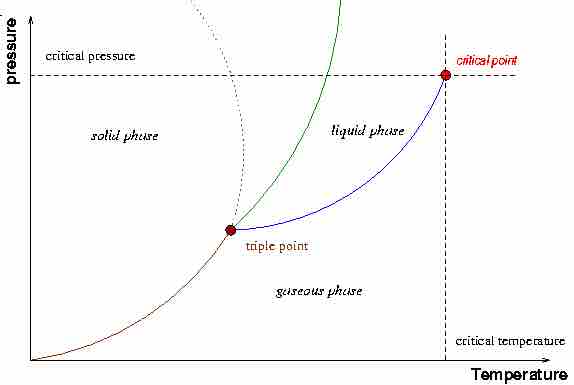
A typical phase diagram illustrating the major components of a phase diagram as well as the critical point. The dotted green line refers to the solid-liquid phase boundary for water.
General observations from the diagram reveal that certain conditions of temperature and pressure favor certain phases of matter. Typically:
- Low temperature/high pressure conditions favor the solid state.
- Moderate temperature/moderate pressure conditions favor the liquid state.
- High temperature/low pressure conditions favor the gaseous state.
The critical point, which occurs at critical pressure (Pcr) and critical temperature (Tcr), is a feature that indicates the point in thermodynamic parameter space at which the liquid and gaseous states of the substance being evaluated are indistinguishable. At this point and beyond it, the substance being evaluated exists as a "supercritical fluid". At temperatures above the critical temperature, the kinetic energy of the molecules is high enough so that even at high pressures the sample cannot condense into the liquid phase.
When evaluating the phase diagram, it is worth noting that the solid-liquid phase boundary in the phase diagram of most substances has a positive slope. This is due to the solid phase having a higher density than the liquid, so that increasing the pressure increases the melting temperature. However, the solid-liquid phase boundary for water is anomalous, in that it has a negative slope. This reflects the fact that ice is lower in density than liquid water (a well-known fact: ice floats), unlike most other substances which typically have denser solid phases.

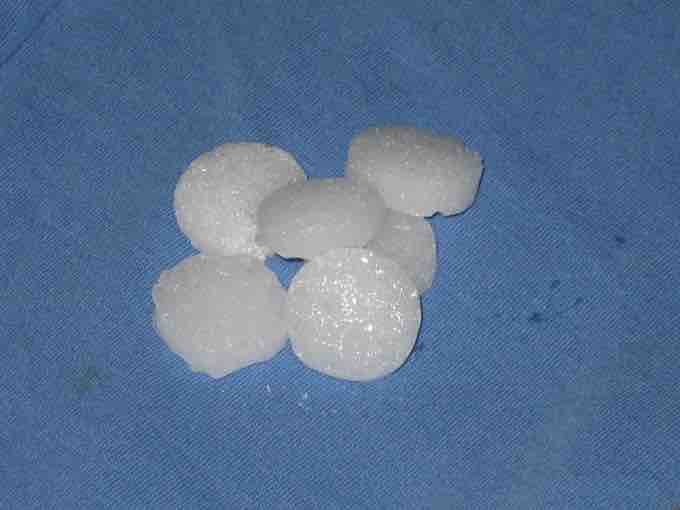
Mothballs - Phase Transitions Applied
The thermodynamic properties of mothballs, made of 1,4-Dichlorobenzene, are used to repel insects. 1,4- Dichlorobenzene sublimates (transitions from solid to gas) at room temperature. The gas released is toxic to insects.
With a knowledge of the major components of phase diagrams and the features of phase plots, a phase diagram can be used to understand how altering thermodynamic parameters influences the states/phases of matter a sample of a substance is in.