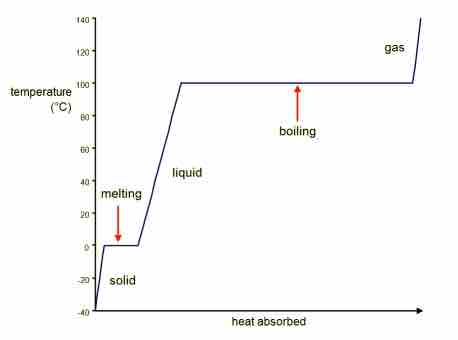
Like many substances, water can exist in different phases of matter: liquid, solid, and gas. A heating curve shows how the temperature changes as a substance is heated up at a constant rate.
Drawing a Heating Curve
Temperature is plotted on the y-axis, while the x-axis represents the heat that has been added. A constant rate of heating is assumed, so that one can also think of the x-axis as the amount of time that goes by as a substance is heated. There are two main observations on the measured curve:
- regions where the temperature increases as heat is added
- plateaus where the temperature stays constant.
It is at those plateaus that a phase change occurs.

Heating Curve of Water
The phase transitions of water.
Analysis of a Heating Curve
Looking from left to right on the graph, there are five distinct parts to the heating curve:
- Solid ice is heated and the temperature increases until the normal freezing/melting point of zero degrees Celsius is reached. The amount of heat added, q, can be computed by:
$q=m\cdot C_{H_2O(s)}\cdot \Delta T$ , where m is the mass of the sample of water, C is the specific heat capacity of solid water, or ice, and$\Delta T$ is the change in temperature during the process. - The first phase change is melting; as a substance melts, the temperature stays the same. For water, this occurs at 0o C. The above equation (described in part 1 of the curve) cannot be used for this part of the curve because the change in temperature is zero! Instead, use the heat of fusion (
$\Delta H_{fusion}$ ) to calculate how much heat was involved in that process:$q=m\cdot \Delta H_{fusion}$ , where m is the mass of the sample of water. - After all of the solid substance has melted into liquid, the temperature of the liquid begins to increase as heat is absorbed. It is then possible to calculate the heat absorbed by:
$q=m\cdot C_{H_2O(l)}\cdot \Delta T$ . Note that the specific heat capacity of liquid water is different than that of ice. - The liquid will begin to boil when enough heat has been absorbed by the solution that the temperature reaches the boiling point, where again, the temperature remains constant until all of the liquid has become gaseous water. At the atmospheric pressure of 1 atm, this phase transition occurs at 100o C (the normal boiling point of water). Liquid water becomes water vapor or steam when it enters the gaseous phase. Use the heat of vaporization (
$\Delta H_{vap}$ ) to calculate how much heat was absorbed in this process:$q=m\cdot C_{H_2O(g)}\cdot \Delta T$ , where m is the mass of the sample of water. - After all of the liquid has been converted to gas, the temperature will continue to increase as heat as added. Again, the heat added that results in a certain change temperature is given by:
$q=m\cdot C_{H_2O(g)}\cdot \Delta T$ . Note that the specific heat capacity of gaseous water is different than that of ice or liquid water. - Water has a high boiling point because of the presence of extensive hydrogen bonding interactions between the water molecules in the liquid phase (water is both a strong hydrogen bond donor and acceptor). When heat is first applied to water, it must break the intermolecular hydrogen bonds within the sample. After breaking the bonds, heat is then absorbed and converted to increased kinetic energy of the molecules in order to vaporize them.