Concept
Version 12
Created by Boundless
Trends in Credit After 2008

Debt to GDP Ratio
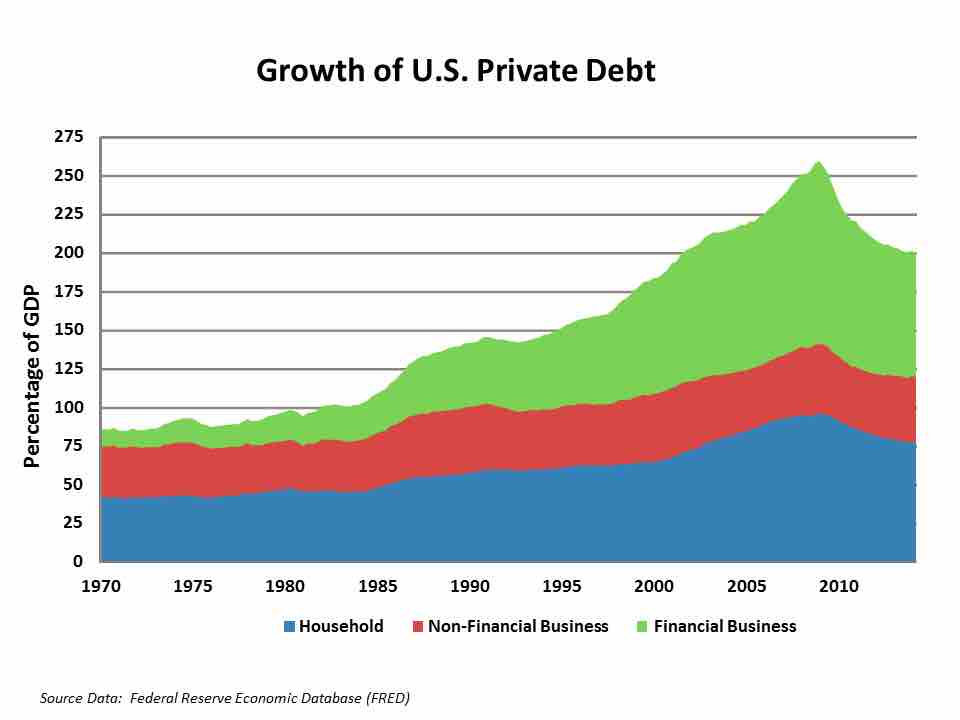
This chart demonstrates the overall percentage of debt owned by governments, companies, and individuals relative to overall GDP. The spike shows how credit before the 2008 disaster was easily obtained (irresponsibly so), and post 2008 the reaction has been a reversal of that trend (albeit, temporarily).
This chart demonstrates the overall percentage of debt owned by governments, companies and individuals relative to overall GDP. The spike shows how credit before the 2008 disaster was easily obtained (irresponsibly so), and post 2008 the reaction has been a reversal of that trend (albeit, temporarily).
Source
Boundless vets and curates high-quality, openly licensed content from around the Internet. This particular resource used the following sources:
"US_Private_Debt_to_GDP_by_Sector.png."
https://upload.wikimedia.org/wikipedia/commons/e/e2/US_Private_Debt_to_GDP_by_Sector.png
Wikimedia
CC BY-SA 3.0.