A system of inequalities is a set of inequalities with multiple variables, often solved with a particular specification of of the values of all variables that simultaneously satisfies all of the inequalities. A system of inequalities can be solved graphically and non-graphically.
Graphical Method
Often the easiest way to solve a system of linear inequalities is by graphing. However, graphing is only possible if there are two or three variables in the system.
When using the graphical method for two variables, first plot all of the lines representing the inequalities, drawing a dotted line if it is either < or >, and a solid line if it is either
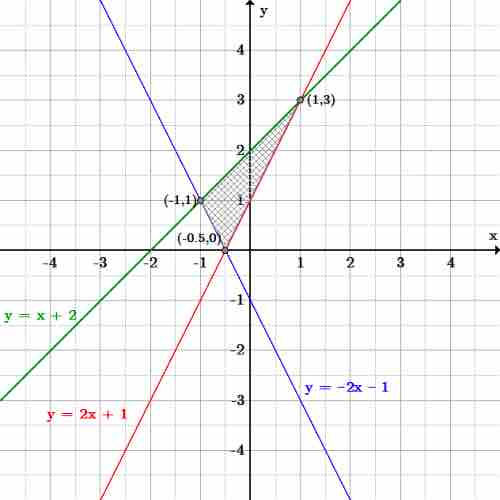
Once all of the inequalities have been drawn and shaded in, the solution to the system is the area in which all of the inequalities overlap each other. For example, given the system:
Draw each of the lines and shade in, or indicate, their corresponding inequalities, and then look to see what parts overlap. The shaded part in the middle is where all three inequalities overlap.

System of inequalities
Three lines are graphed, with the area that satisfies all three inequalities shaded.
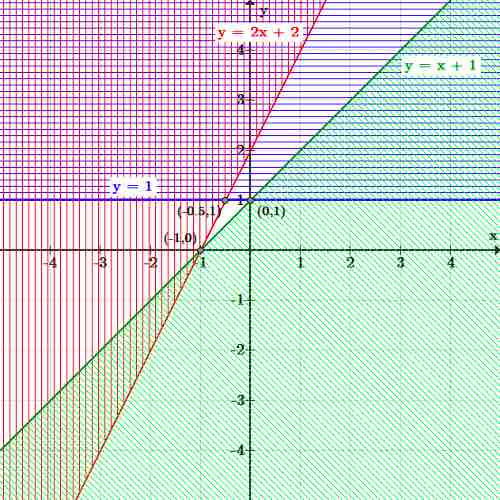
If all of the inequalities of a system fail to overlap over the same area, then there is no solution to that system. For instance, given the following system:
Again, draw all the inequalities and shade in the area that each inequality covers.

System of inequalities with no solution
Three inequalities are graphed. There is no area which is shaded by all three inequalities, so the system of inequalities has no solution.
Notice that in this graph, there is no part of the graph where all three inequalities overlap. There are plenty of areas where two of the three overlap at a time, but all three must overlap for those points to be a solution to the system.
Non-Graphical Method
Sometimes one may not wish to graph the equations, or simply cannot, due to the number of variables. In this situation, find intervals in which certain variables satisfy the system by looking at two equations at a time. This is referred to as the non-graphical method.
First, find the intersection point(s) of two of the equations. If there is no intersection, then the two inequalities are either mutually exclusive, or one of the inequalities is a subset of the other. For a simple example,
To find the intersection point of this system:
first, substitute for
Then, substitute a value for
The non-graphical method is much more complicated, and is perhaps much harder to visualize all the possible solutions for a system of inequalities. However, when you have several equations or several variables, graphing may be the only feasible method.