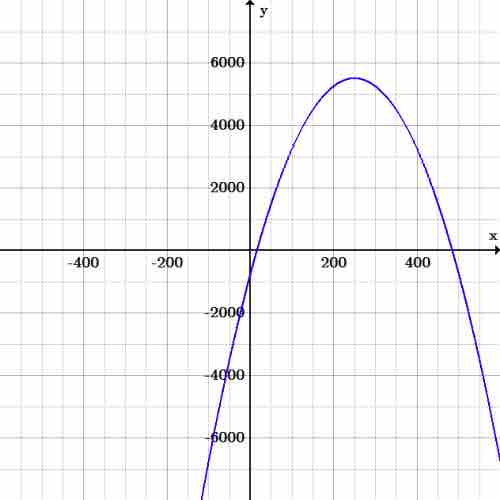
The method of graphing a function to determine general properties can be used to solve financial problems.Given the algebraic equation for a quadratic function, one can calculate any point on the function, including critical values like minimum/maximum and x- and y-intercepts.
These calculations can be more tedious than is necessary, however. A graph contains all the above critical points and more, and acts as a clear and concise representation of a function. If one needs to determine several values on a quadratic function, glancing at a graph is quicker than calculating several points.
Example
Consider the function:
Suppose this models a profit function
If a financier wanted to find the number of sales required to break even, the maximum possible loss (and the number of sales required for this loss), and the maximum profit (and the number of sales required for this profit), they could simply reference a graph instead of calculating it out algebraically.

Financial example
Graph of the equation
By inspection, we can find that the maximum loss is $750 (the y-intercept), which is lost at both